Implementing
Curators not only have limited feedback on visitor emotions, but even if they had a surplus of information, there would be no time in a curator’s busy schedule to sort through it. There’s currently no good way for a curator to know whether exhibits (and specific pieces of art) cause confusion or spark inspiration in the visitors who experience them. Furthermore, curators have noticed that, due to their busy schedules, there’s a lack of connection between themselves and the museum visitors.
Since there are multiple other groups focusing on data collection, we decided to pivot our project from our original idea and assume that we have all necessary data (i.e. feedback from museum visitors about exhibits and artwork). Our vision is to create a mobile application that will not only organize and present user data in an effective way, but allow curators to understand the experiences of visitors without sacrificing large amounts of time. Through interviews and usability tests with various Williams students and WCMA curators, we have created a design that allows quick access to useful exhibit/artwork analytics as well as an easy way for curators to respond to visitor questions and suggestions. Our focus has changed over time, but our original project proposal can be found here.
Note: our initial paper prototype is not refined based on the feedback we received. This is because we address those issues in future iterations. In particular, we realized our tasks may have been a little vague and didn’t reflect what we intended. Additionally, the log-in screen was probably not necessary. However, we will show the original tasks and screens here to illustrate how our design developed over time.
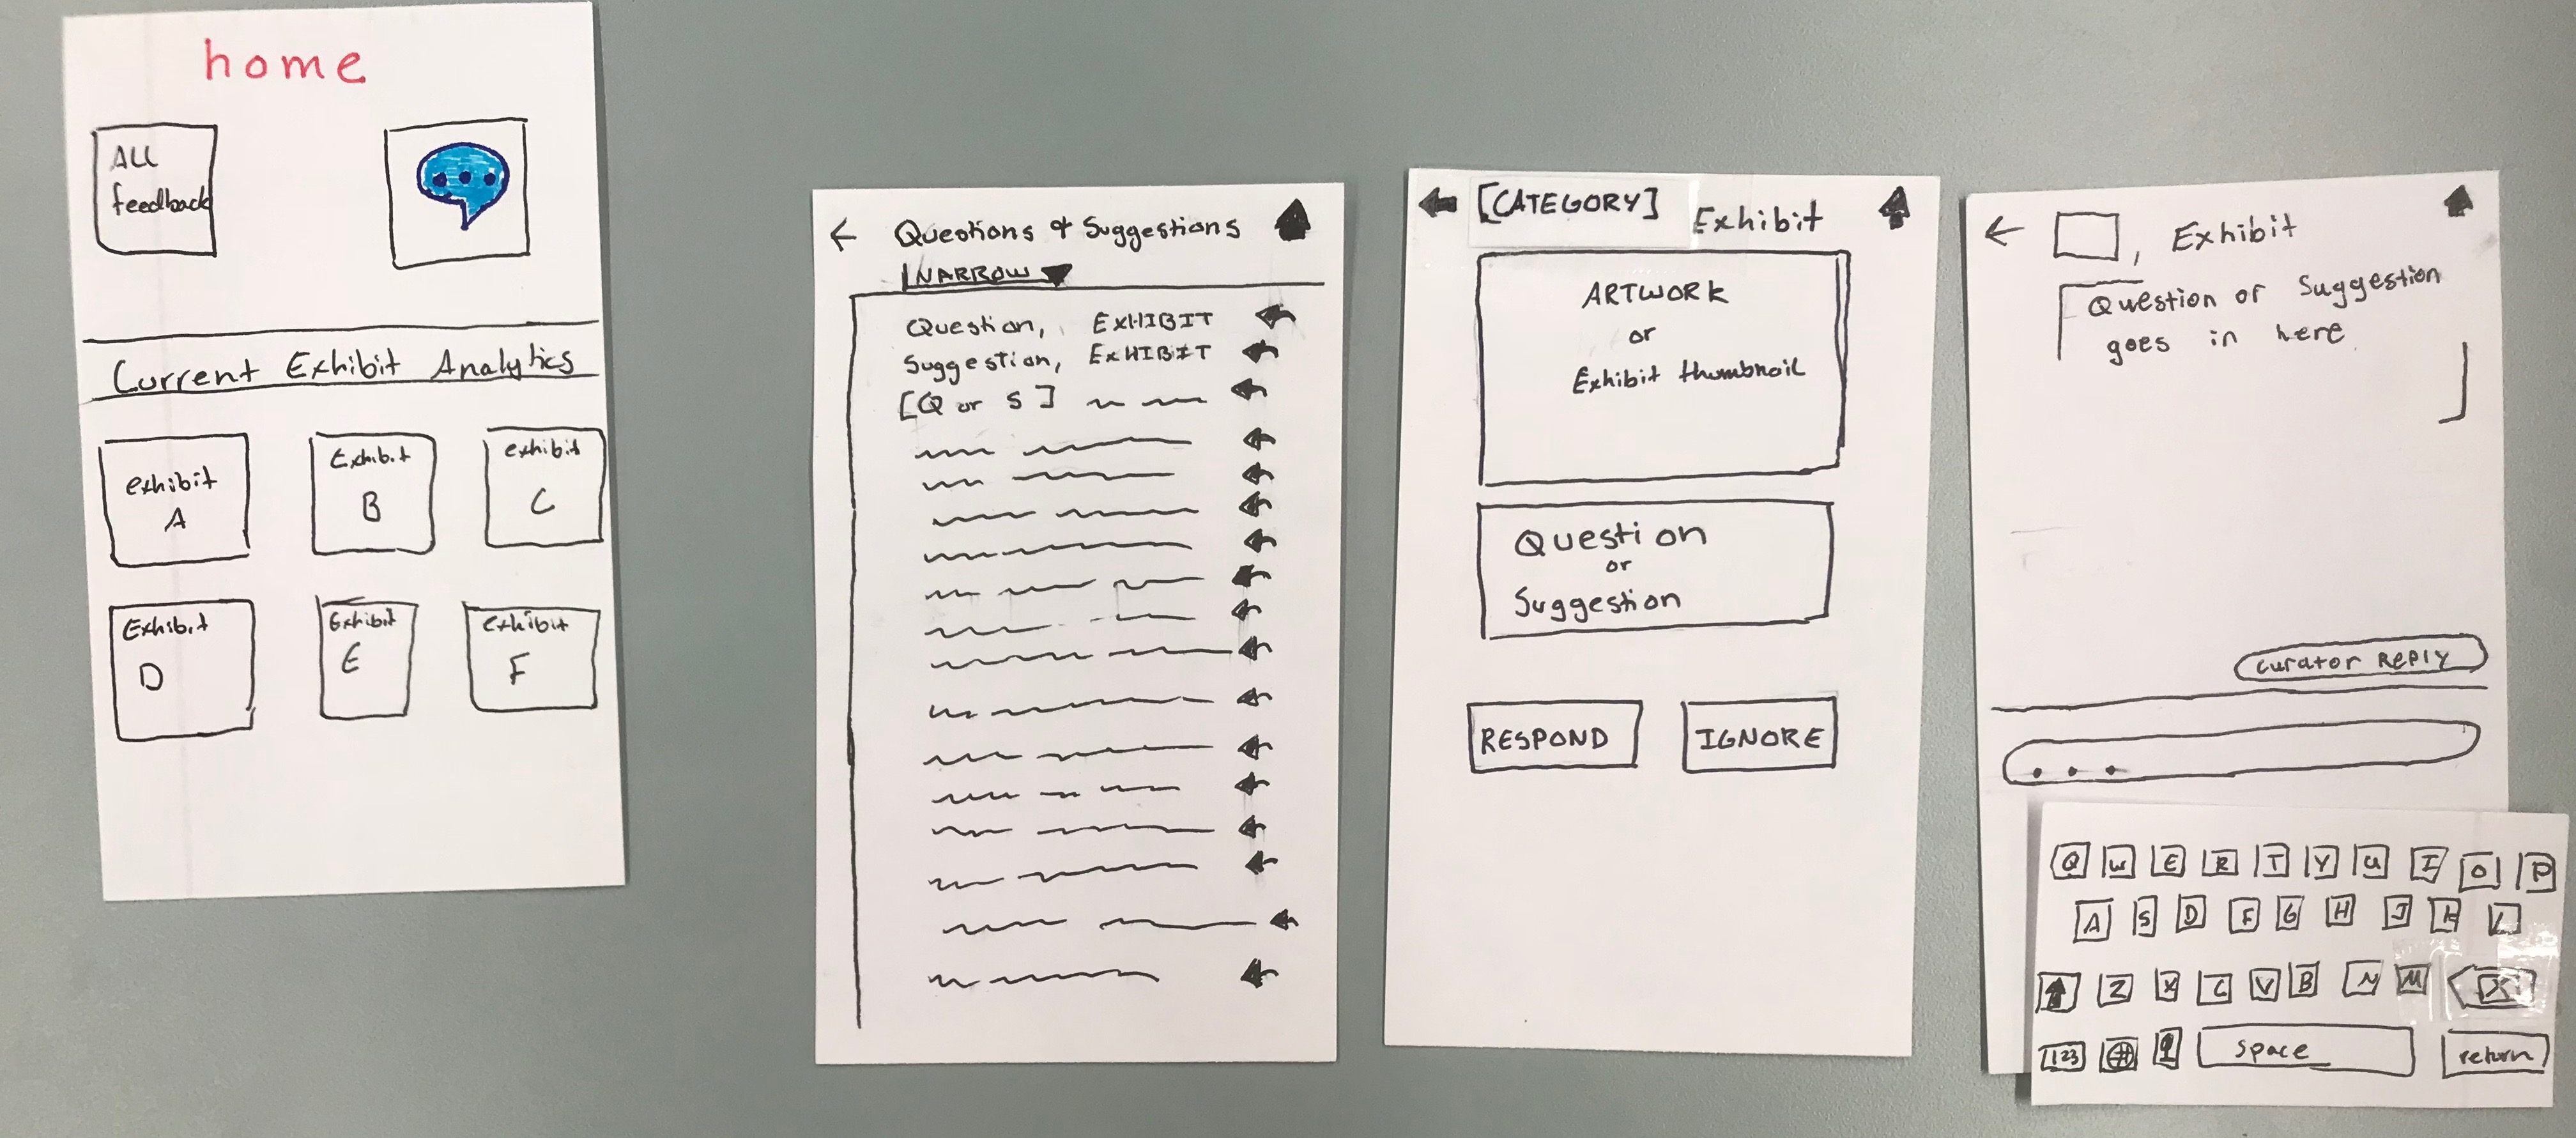
Here is an overview of our mobile application design for curators. After progressing past the log-in screen, users are sent to the home screen. This is the main hub where curators can begin their navigation towards either of our main tasks. The first path allows them to view data based on the exhibits and artwork while the second path allows them to communicate directly with museum visitors. More detailed information is discussed in the task walkthroughs.
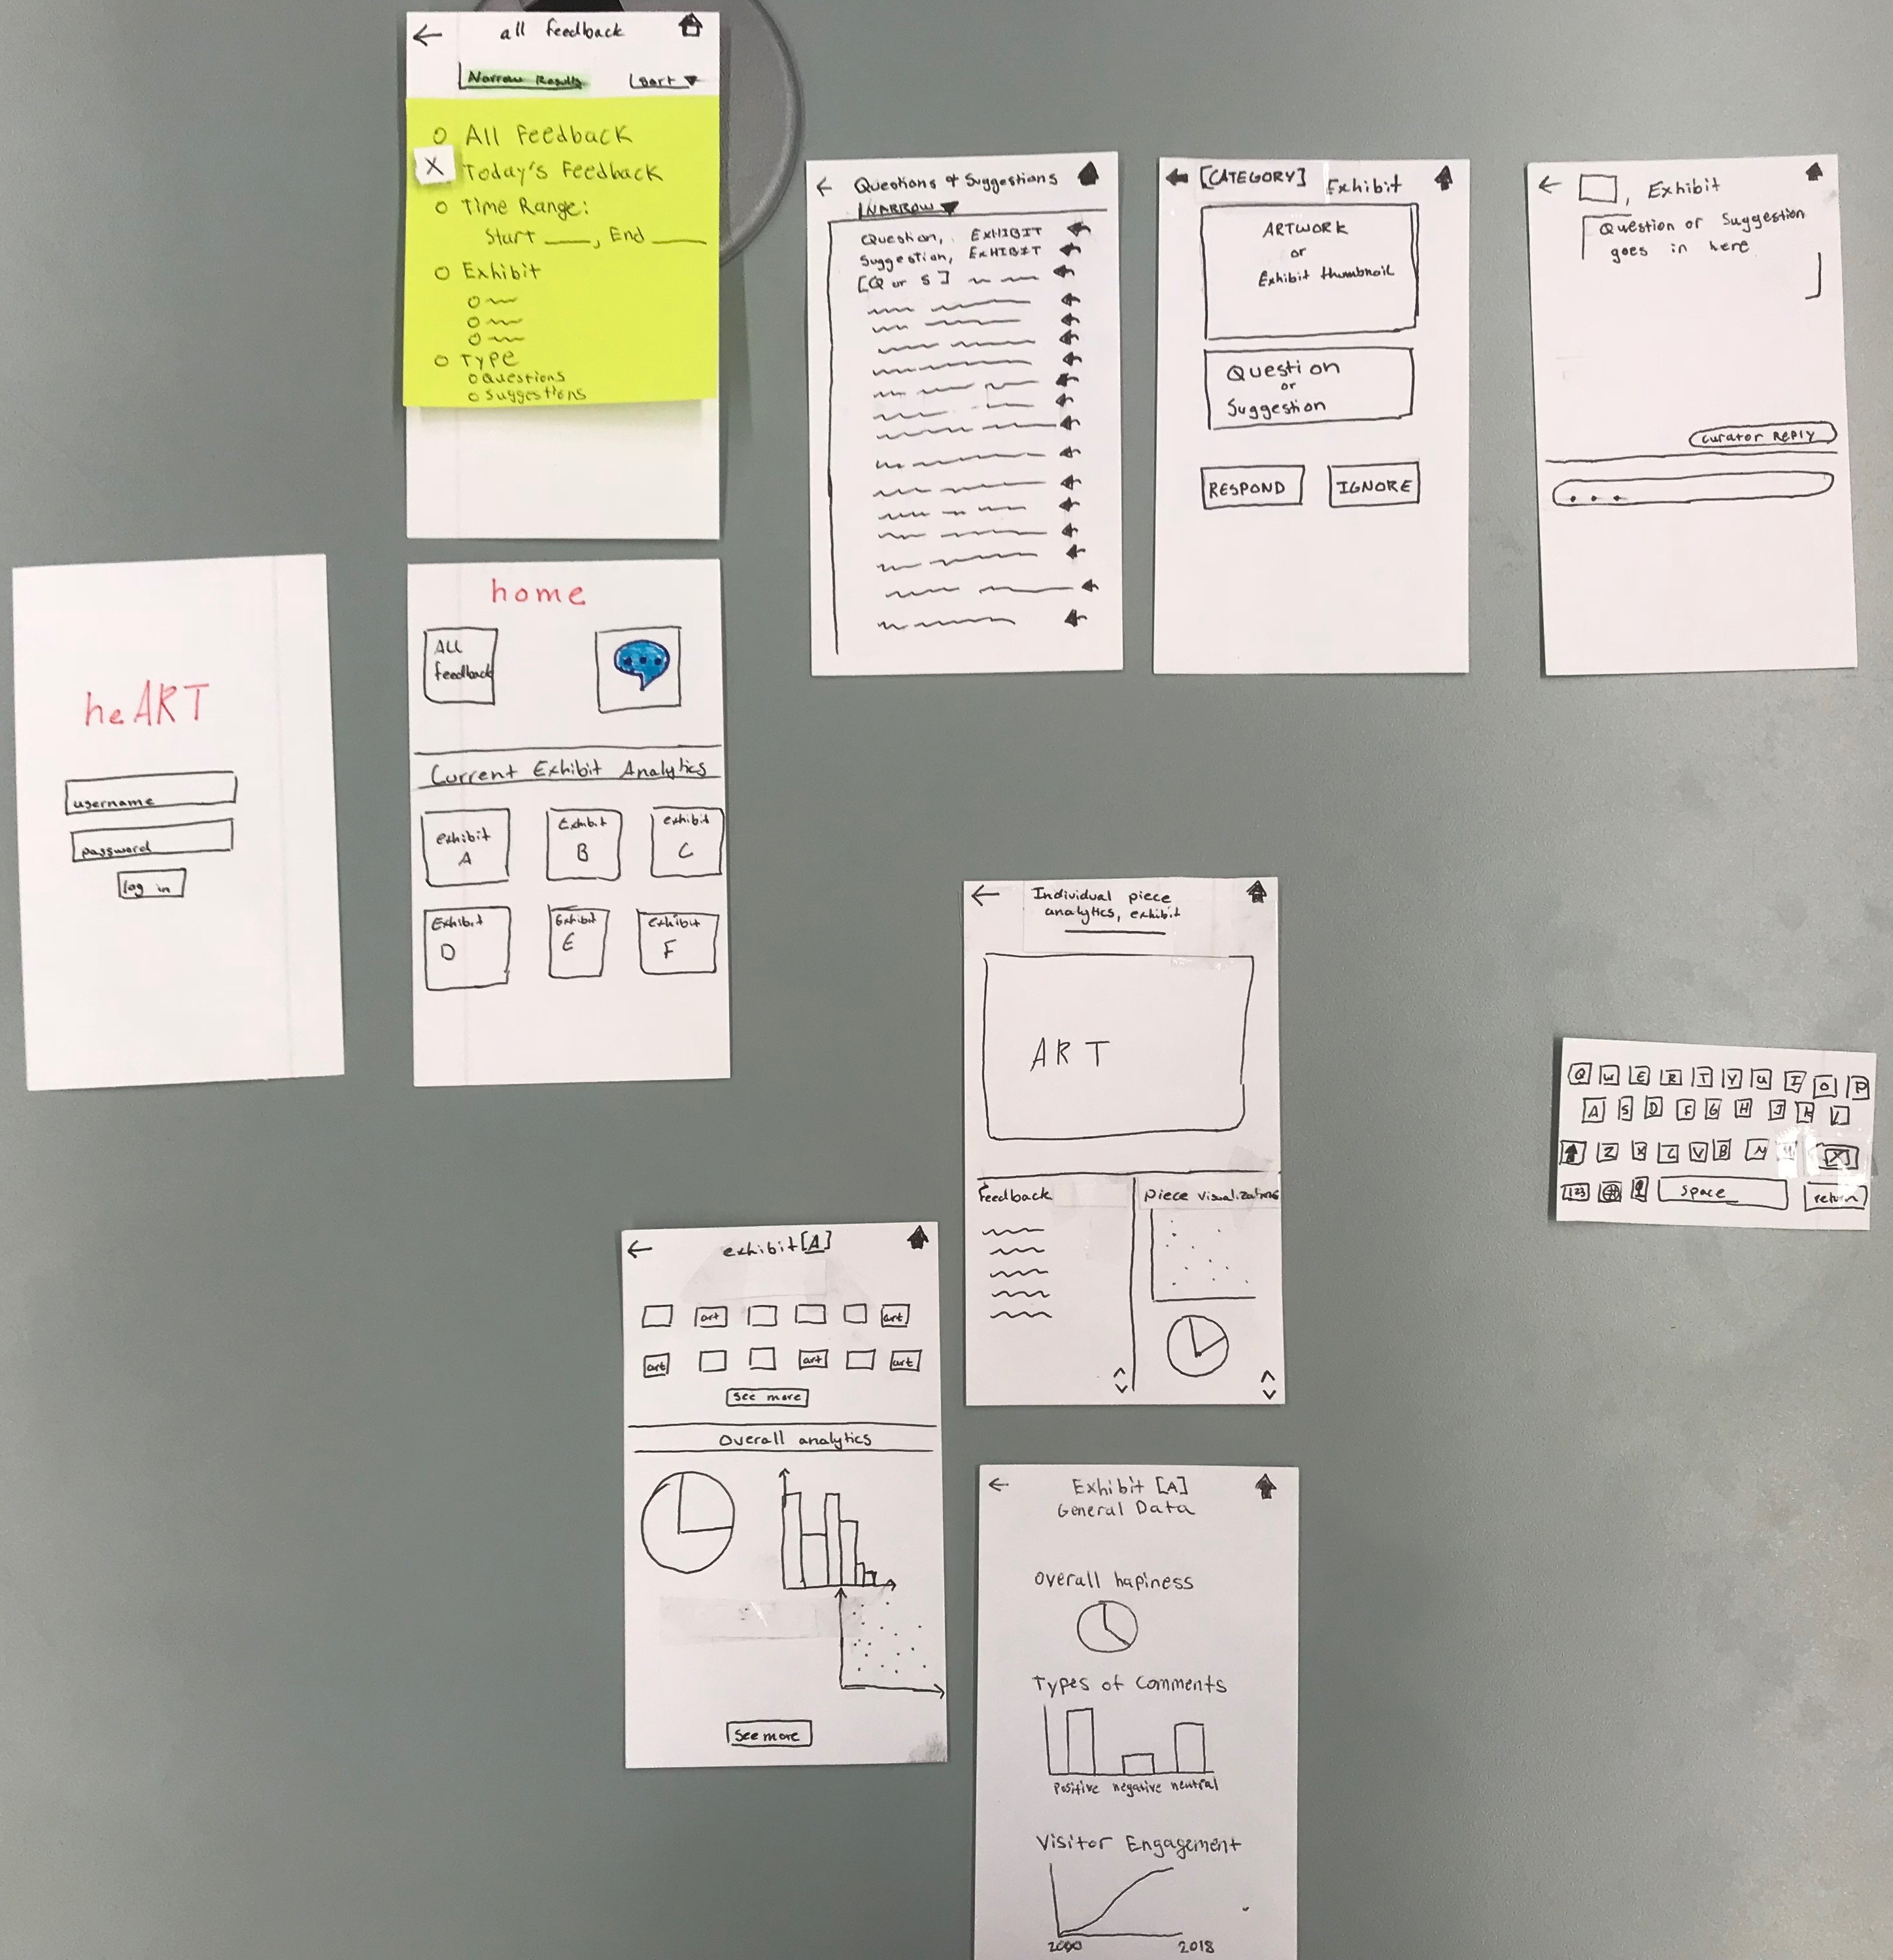
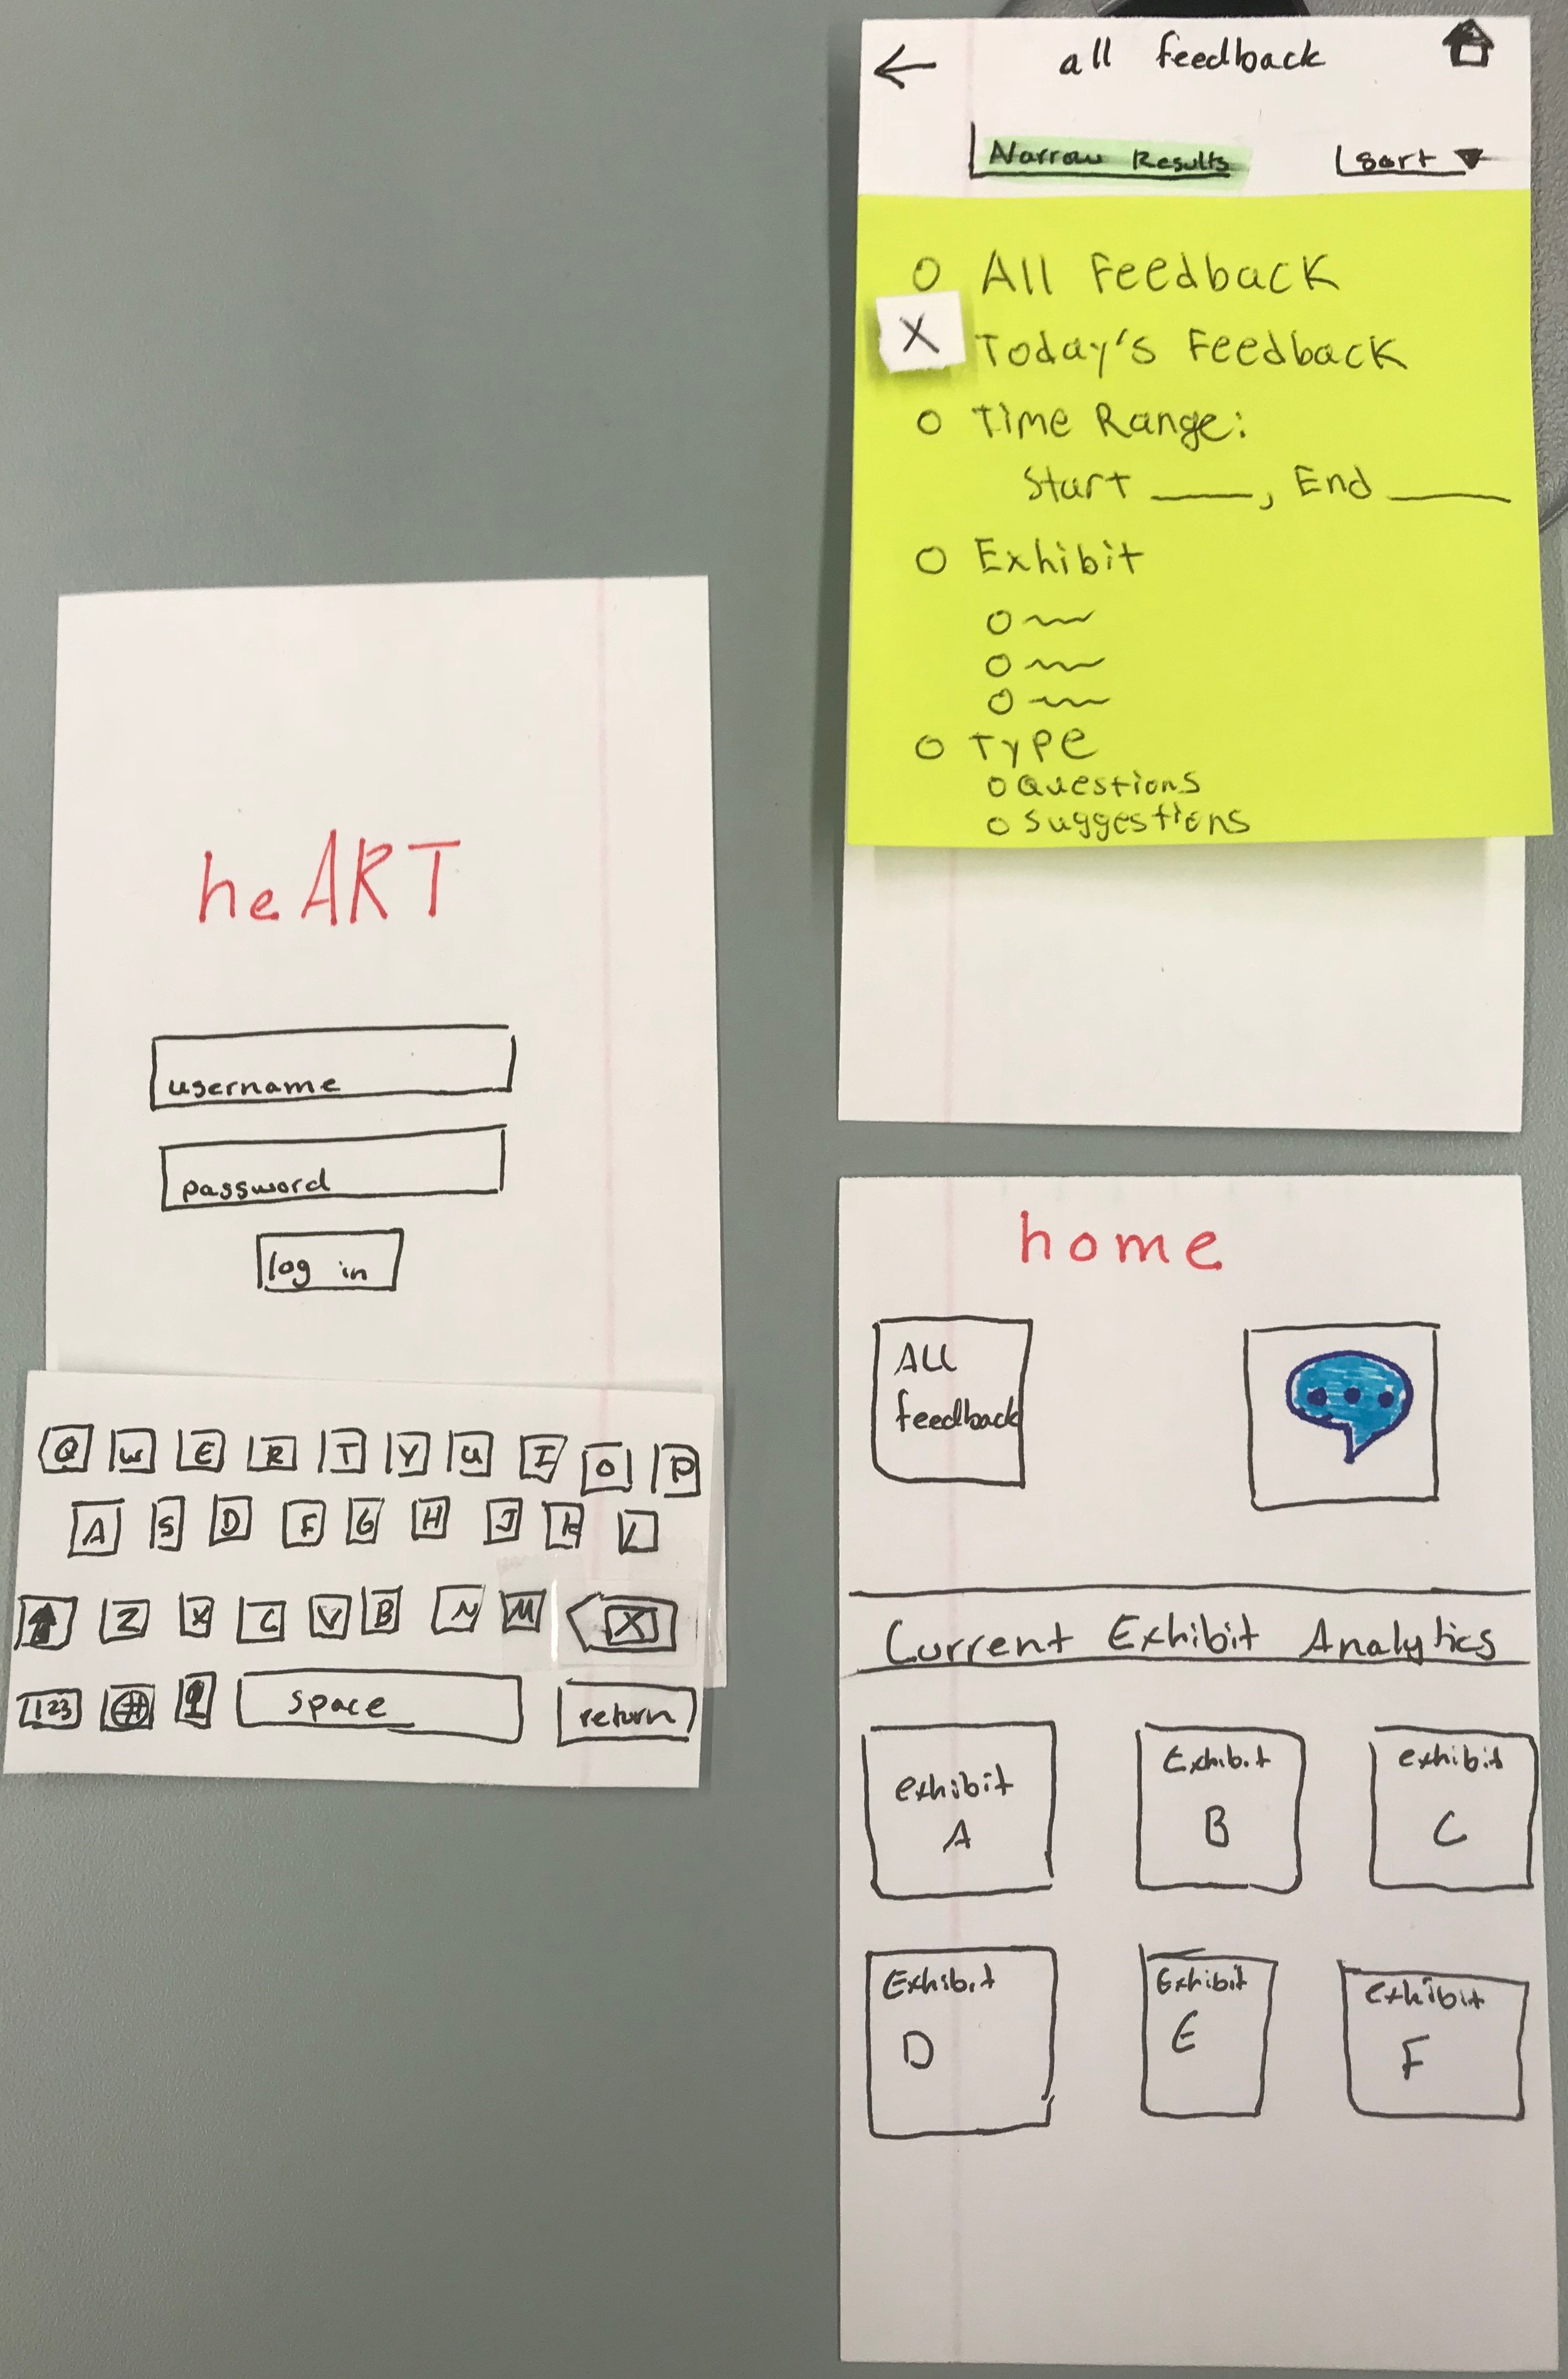
We have two ways users can access and visualize the feedback data. After logging in, the user will be taken to the home screen seen on the bottom right side of the picture. They then have a couple options from here: click the all feedback button, click the thought bubble icon, or click one of the exhibits listed on the bottom half of the screen. Let’s first assume they click the all feedback button. They will then be taken to the top right screen. This will show all visitor feedback from most recent to least recent. The sort button allows the curators to organize it from least recent to most recent. Additionally, there is a “narrow” field that results in a drop down, allowing the user to specify the feedback they want to see.
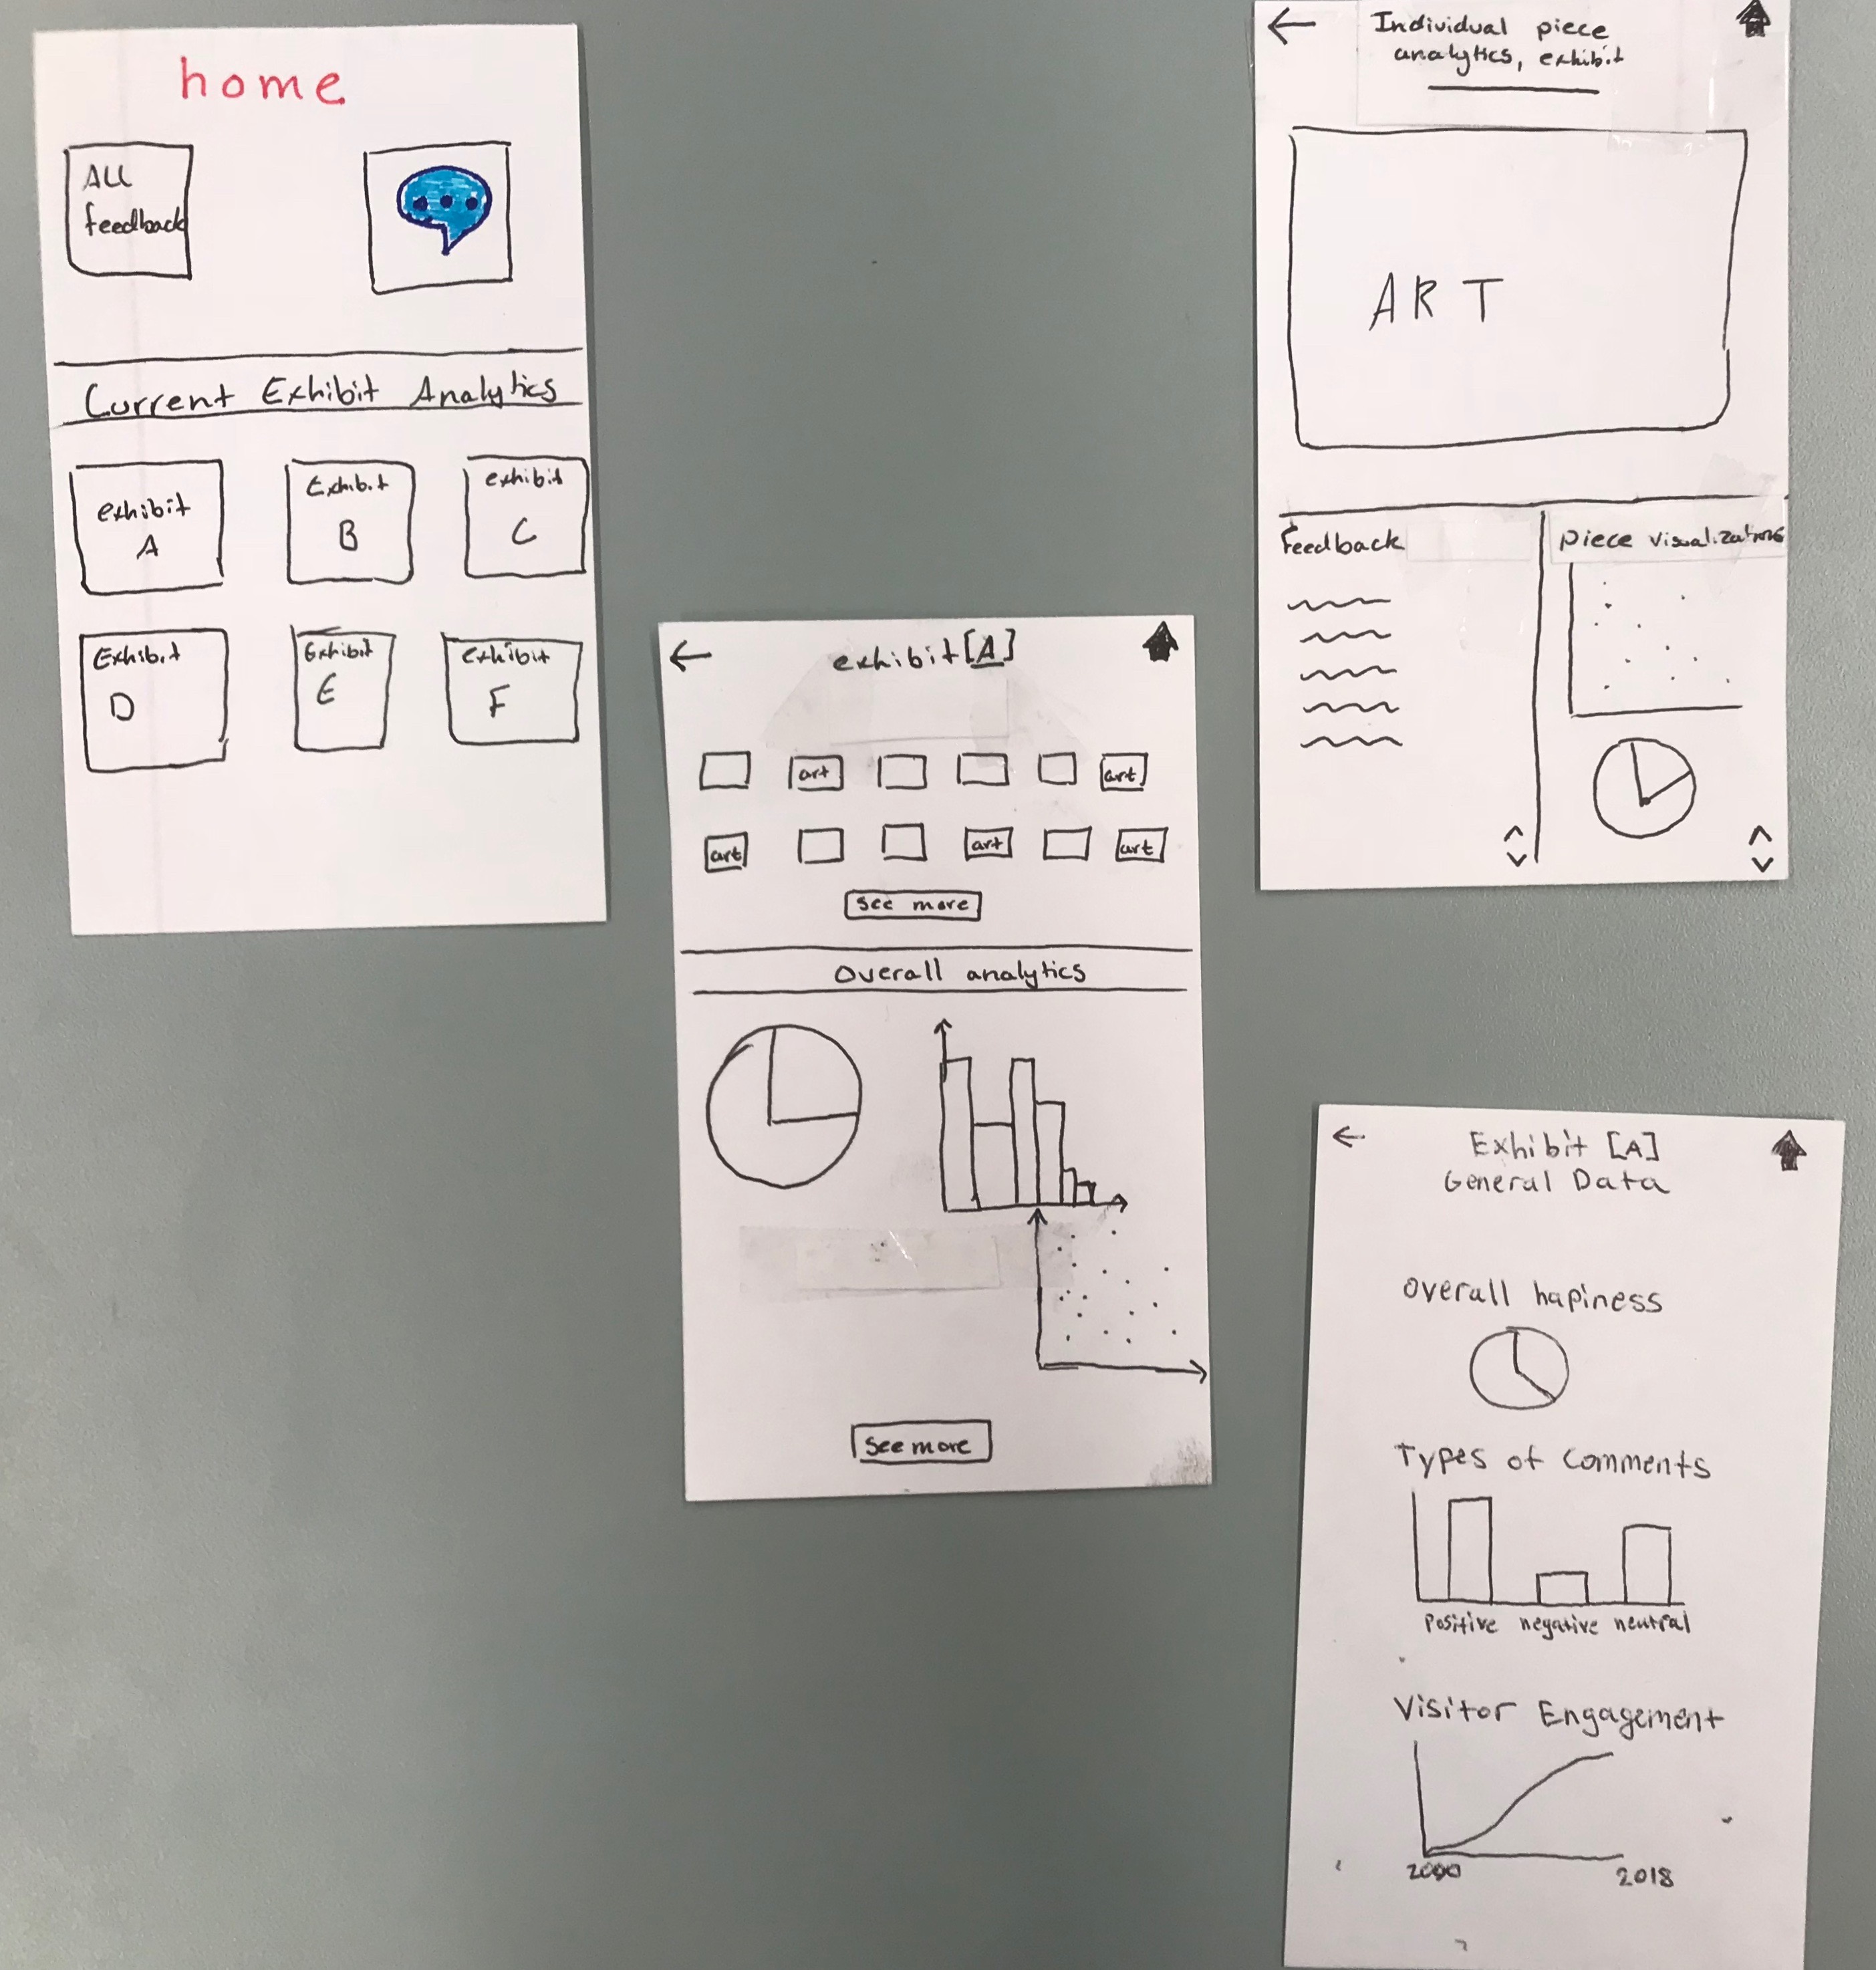
The other way users can see feedback is through specific exhibits. Let’s say we’re back on the home page and the user decides to click on exhibit A. They will be brought to the middle screen where they will see artwork that was most recently commented on in that exhibit, and data analytics (i.e. graphs and charts) giving them information about the exhibit as a whole. When they click on a piece of art, they will be brought to the top right screen, showing them the piece, recent feedback about the piece, and data/graphs specific to that piece. On the other hand, if the user clicked on the “see more” for the data analytics, they would be brought to the bottom right screen, showing them all of the data for the exhibit as a whole.
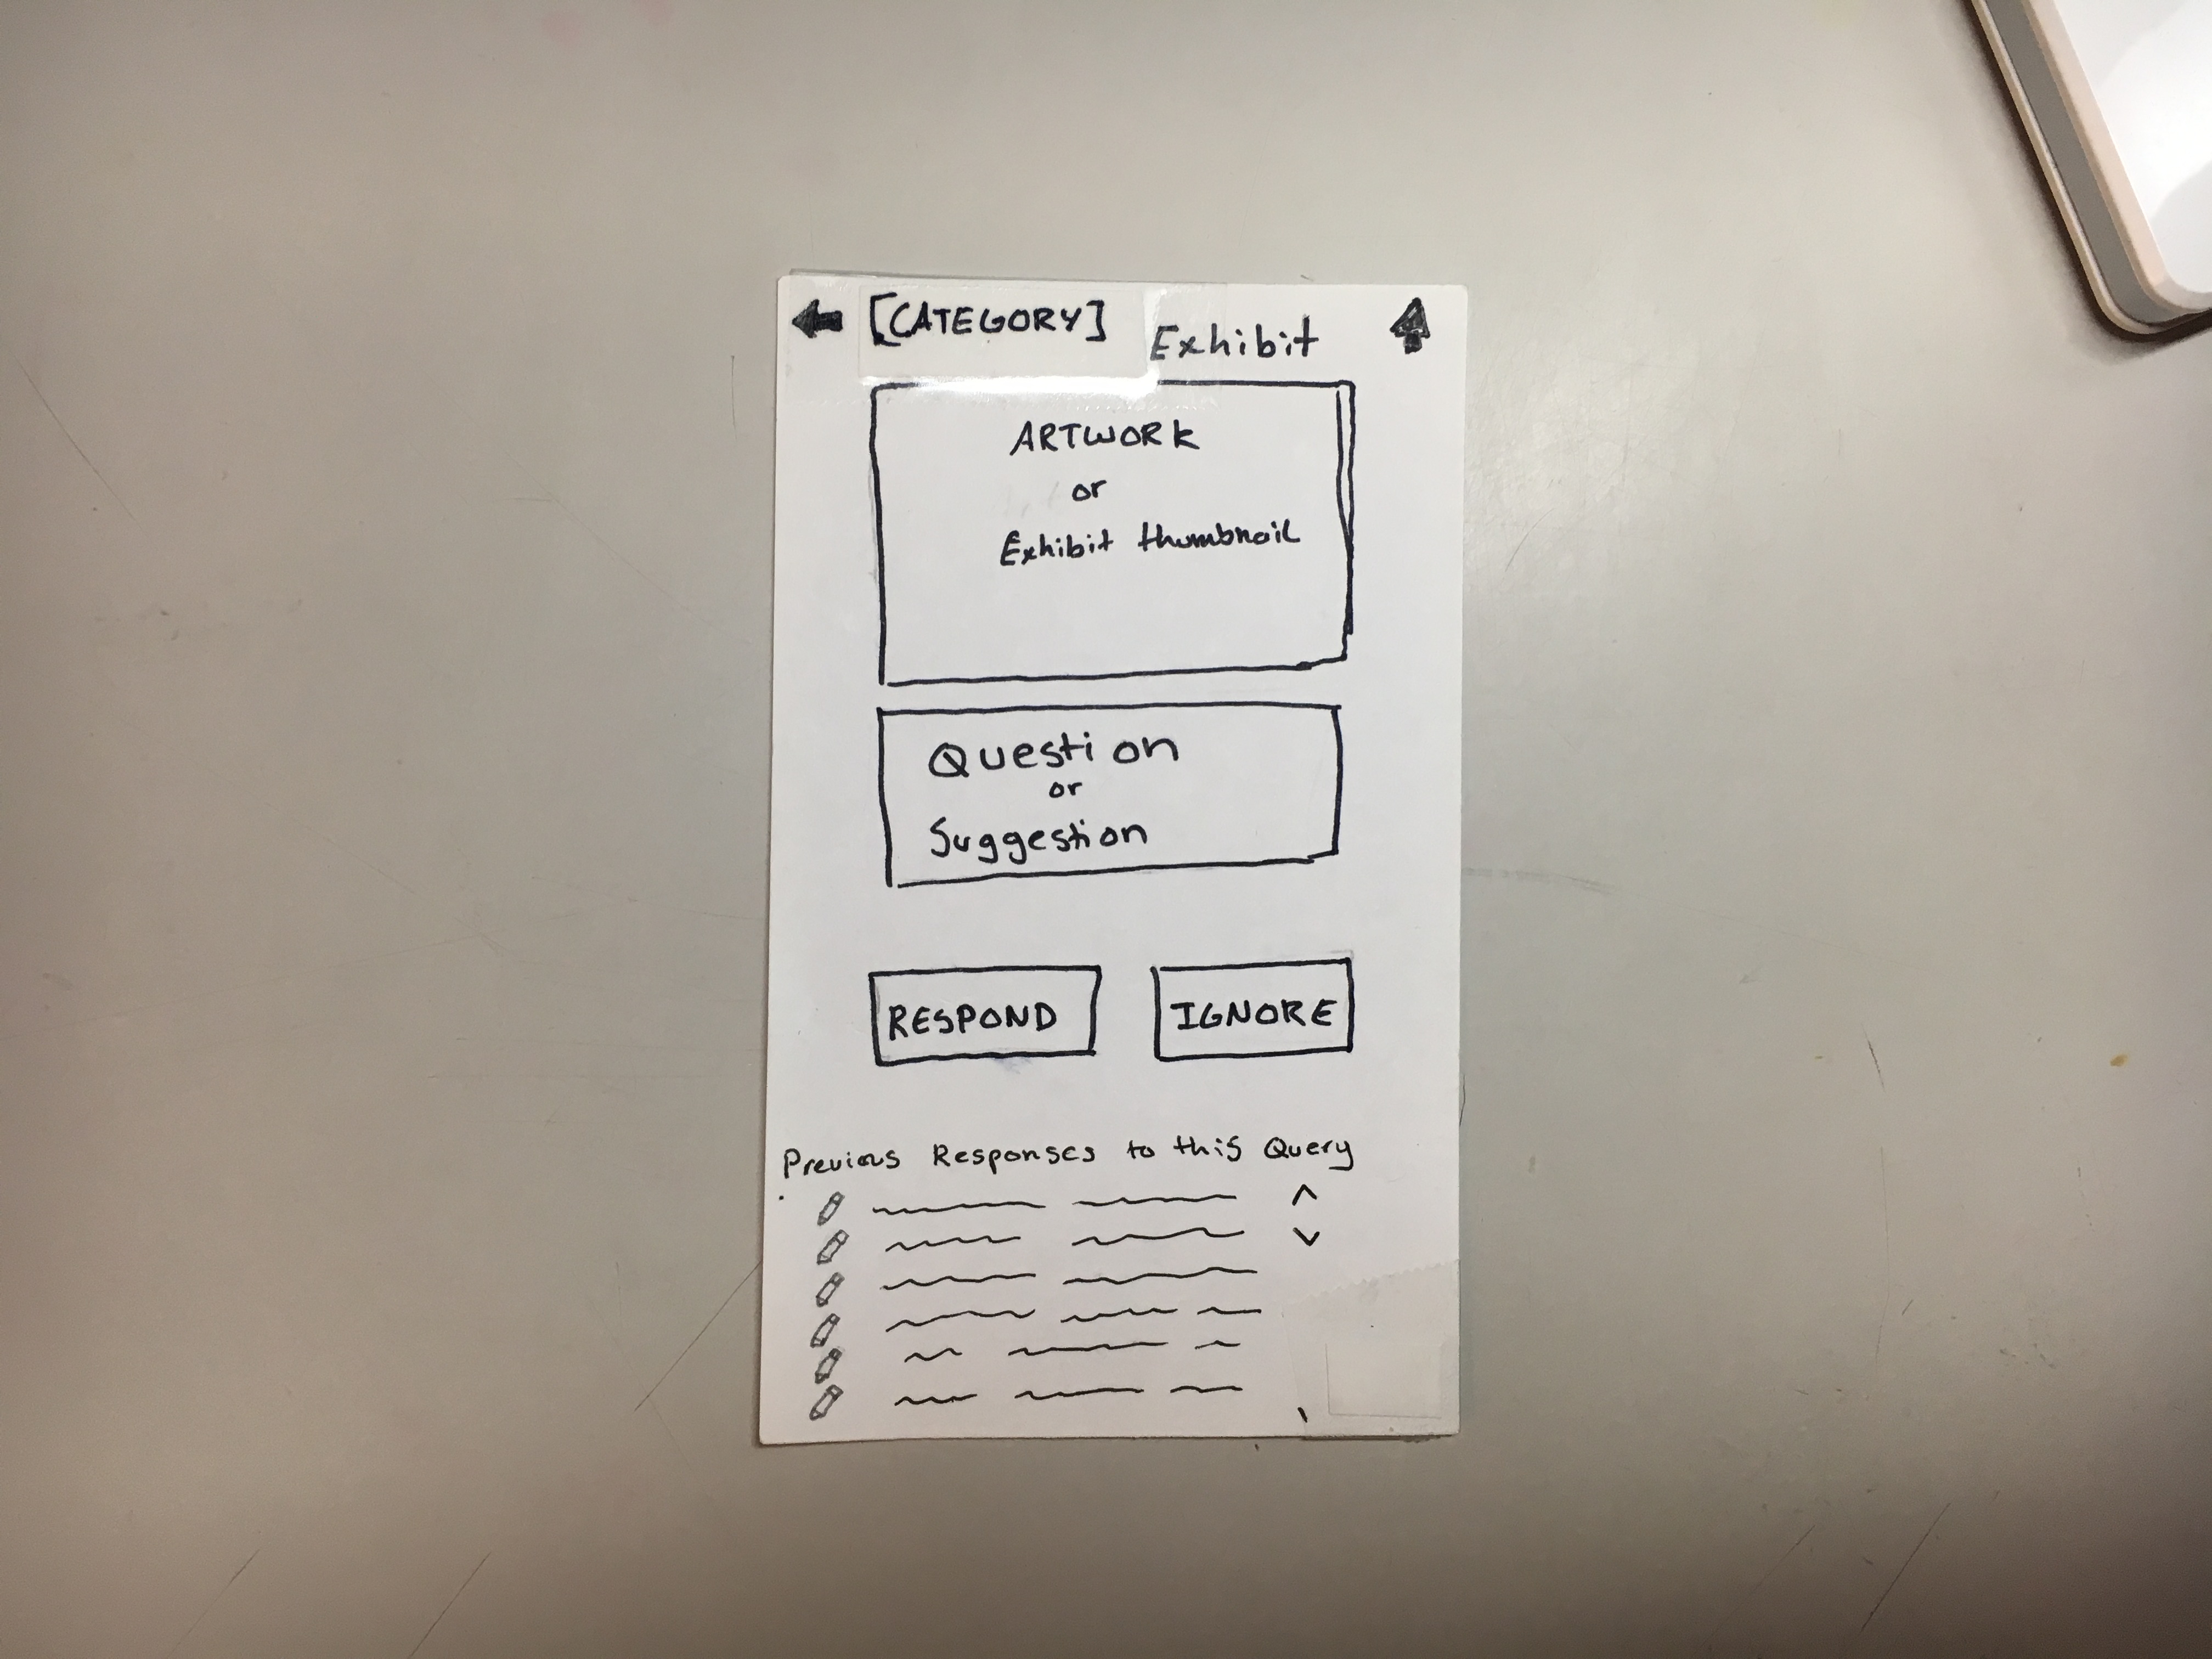
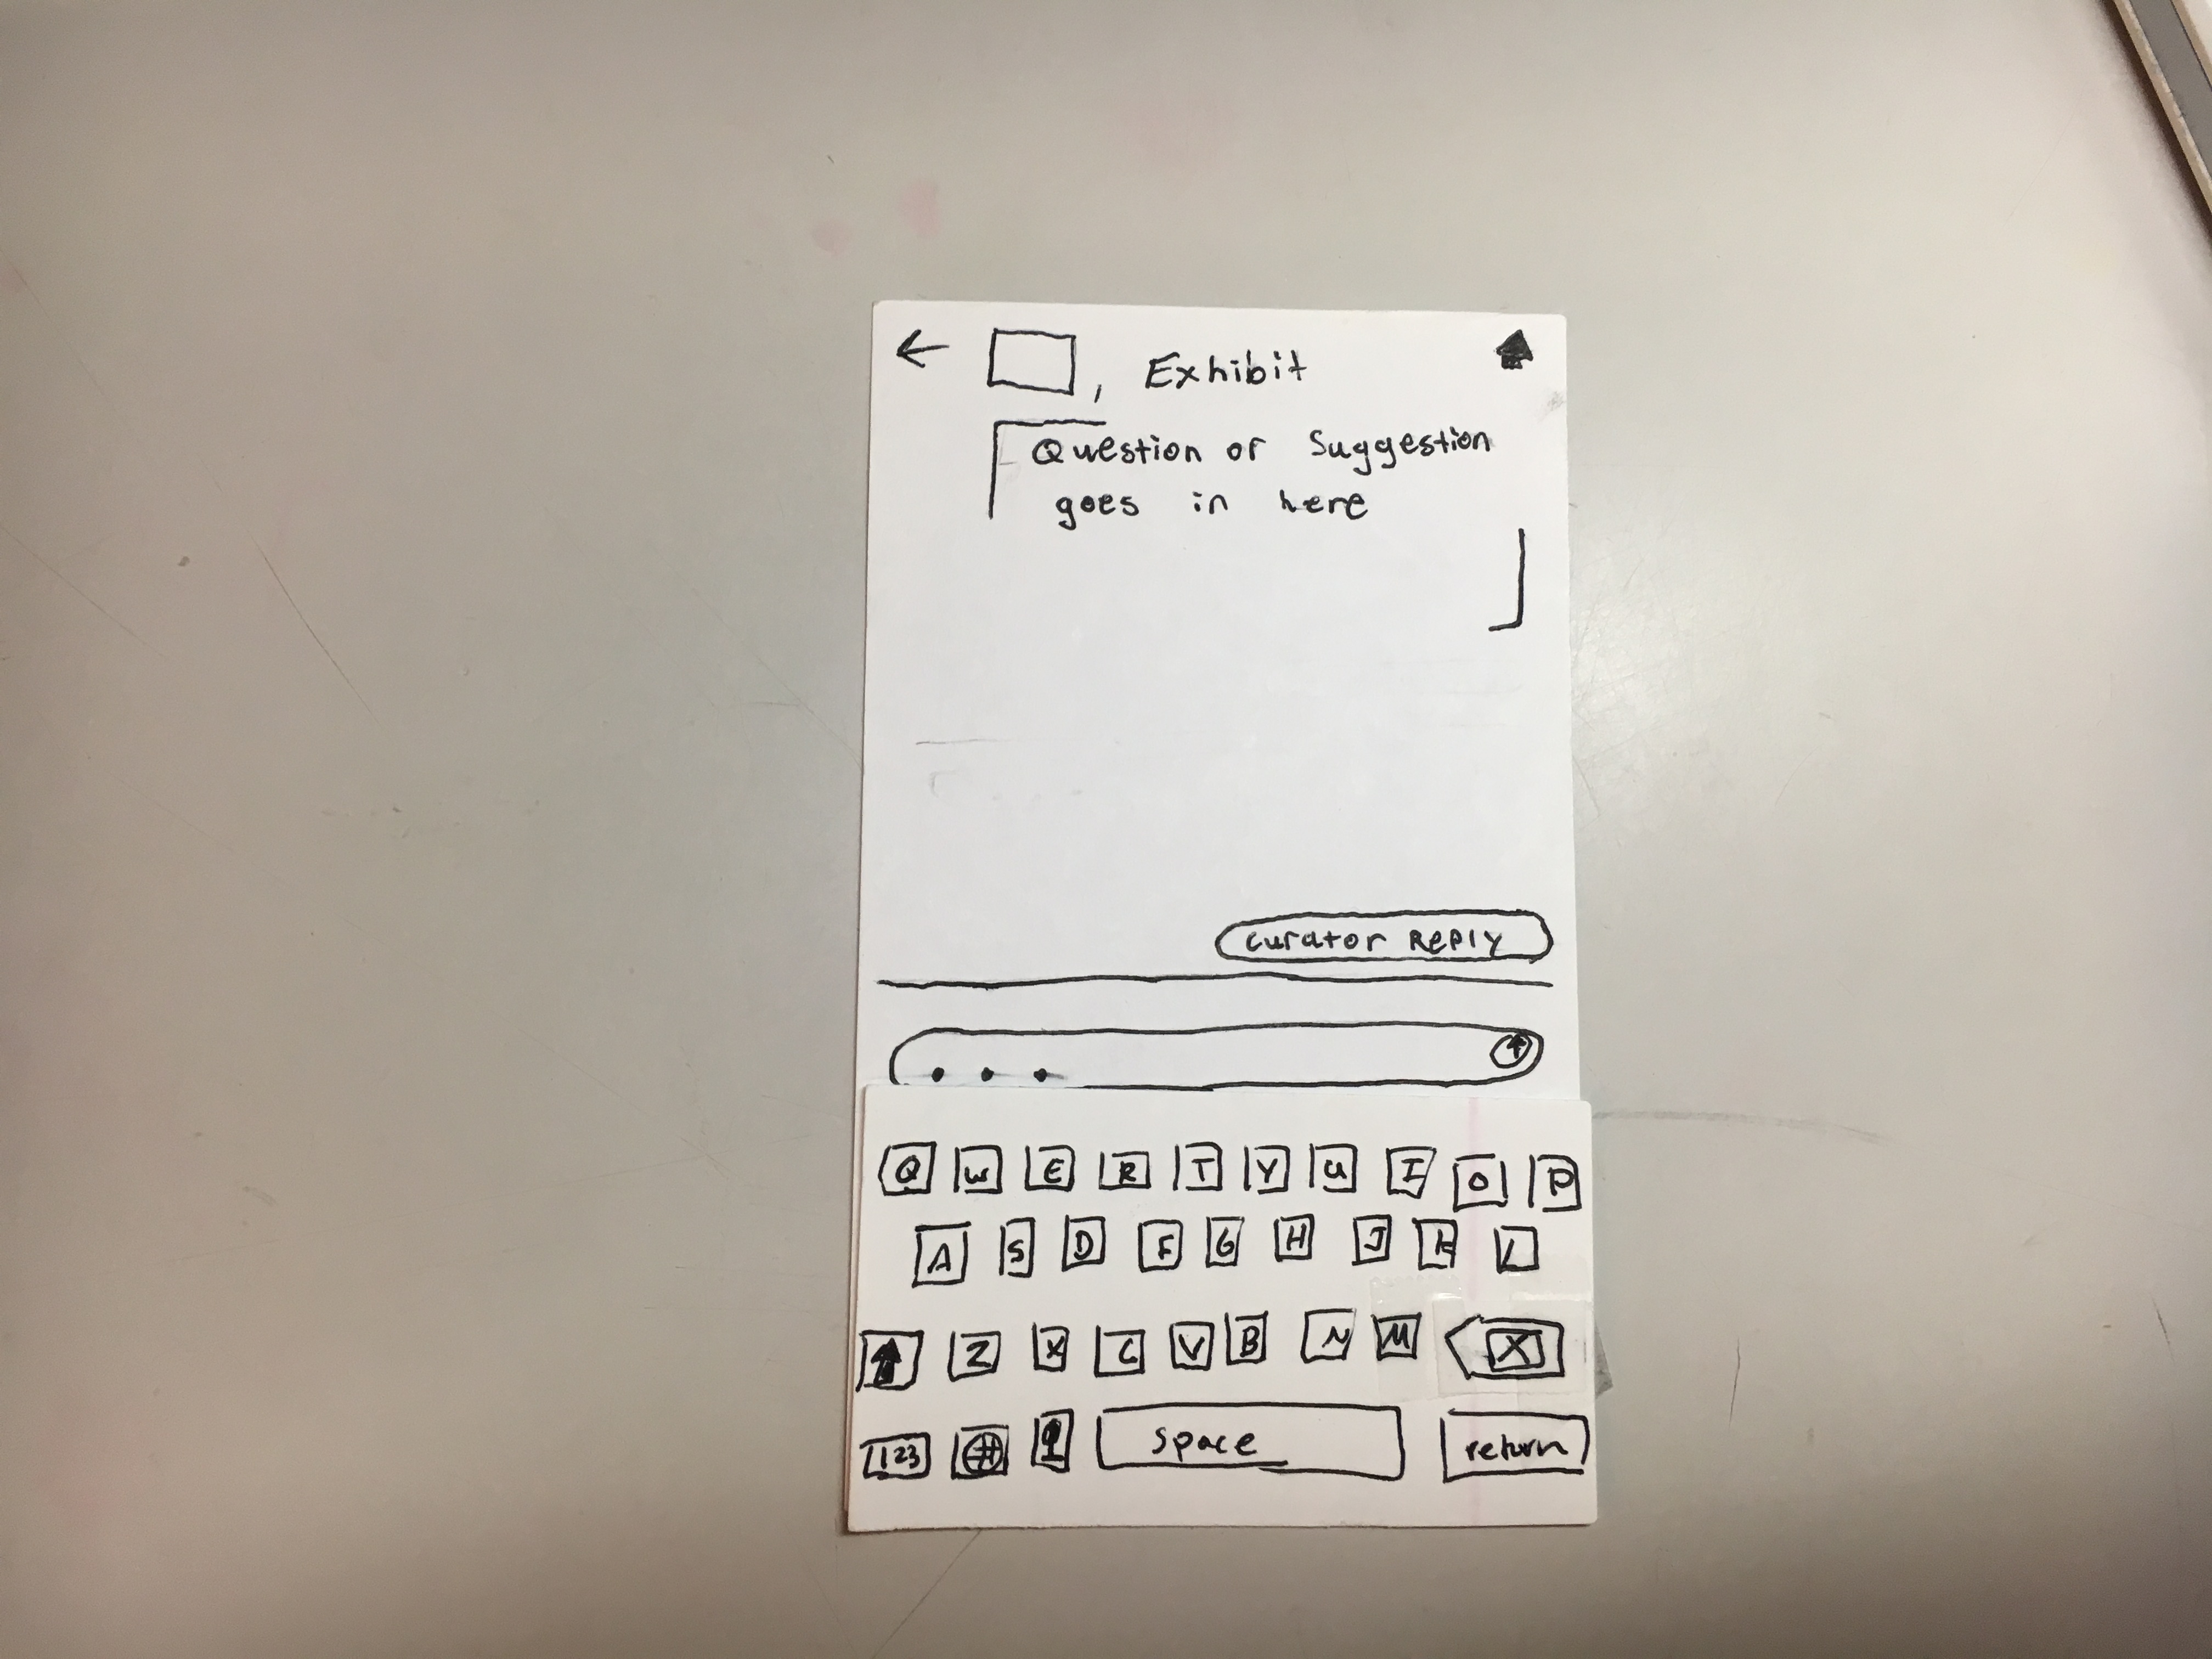
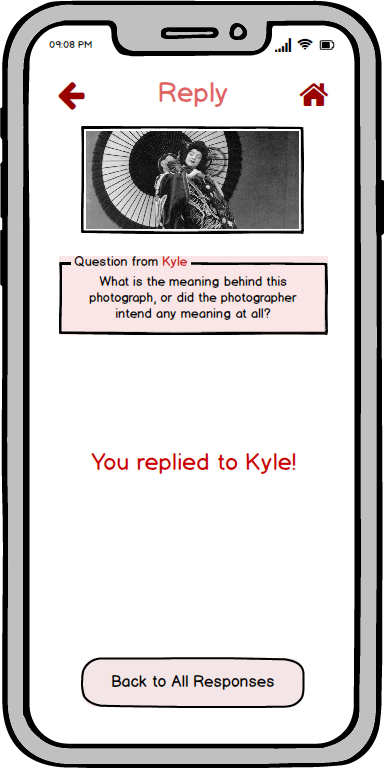
Now assume we’re back on the home screen. If the user clicks on the thought bubble, they will be brought to the middle-left screen, showing them short notation of questions and suggestions (i.e. if the question is too long then it will be cut off) and the exhibit it is referring to. By clicking on one of the reply buttons, the user will be taken to the middle-right screen, showing them a picture of the piece of exhibit, followed by the full question/suggestion, and the option to reply or ignore it. By clicking reply, the user then goes to the rightmost screen, opening a chat window that lets them send a message to the visitor who asked it. Aside: since we are creating a design for curators as our primary user, we are ignoring the implementation of the museum visitor aspects. Therefore, for now, we are not worrying about how this response gets into the hands of the visitor.
The first step in our testing process was a heuristic evaluation. We completed two evaluations in class and one was done outside of class. In the first evaluation, Chris was the computer, Kenneth took notes, Landon tested MUSE’s design, and Dana from MUSE was the evaluator. In the second evaluation, Landon was the computer, Chris took notes, Kenneth tested MUSE’s design, and Jamie from MUSE was the evaluator. Finally, since Chris was not able to test MUSE’s product, he did a heuristic evaluation of his group’s own updated paper prototype. The three heuristic evaluations can be found at the bottom of our heuristic evaluation page.
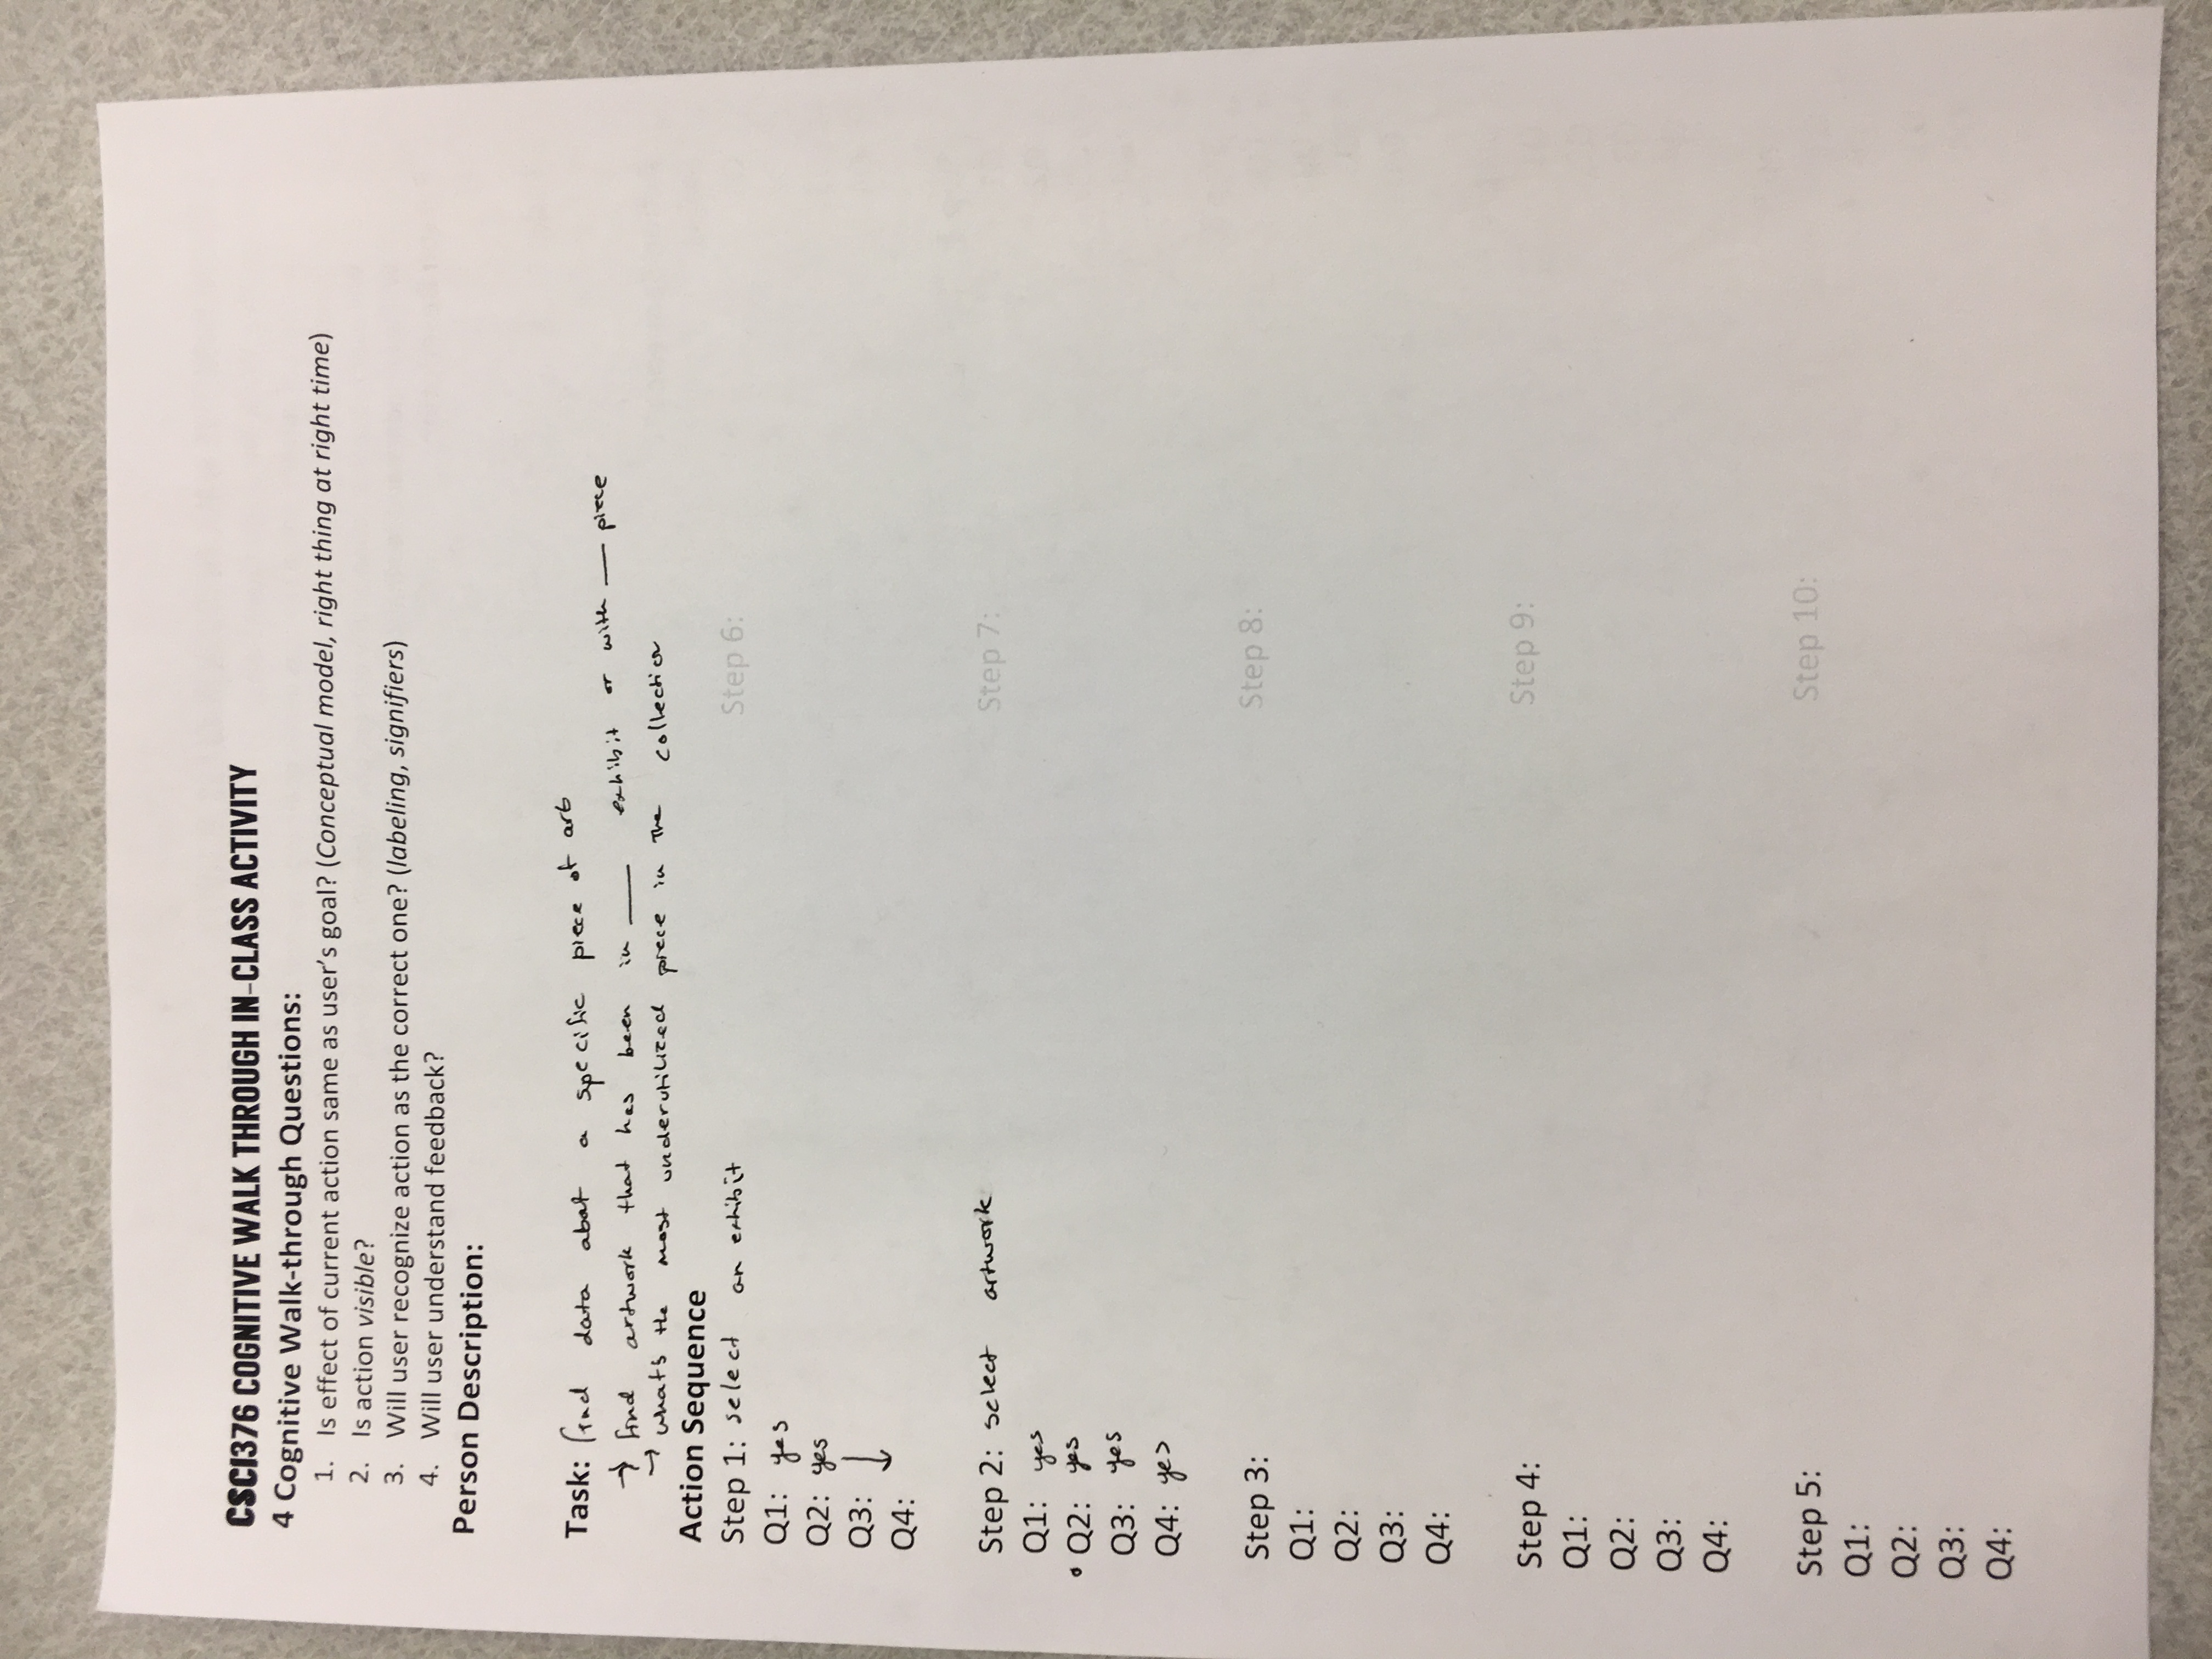
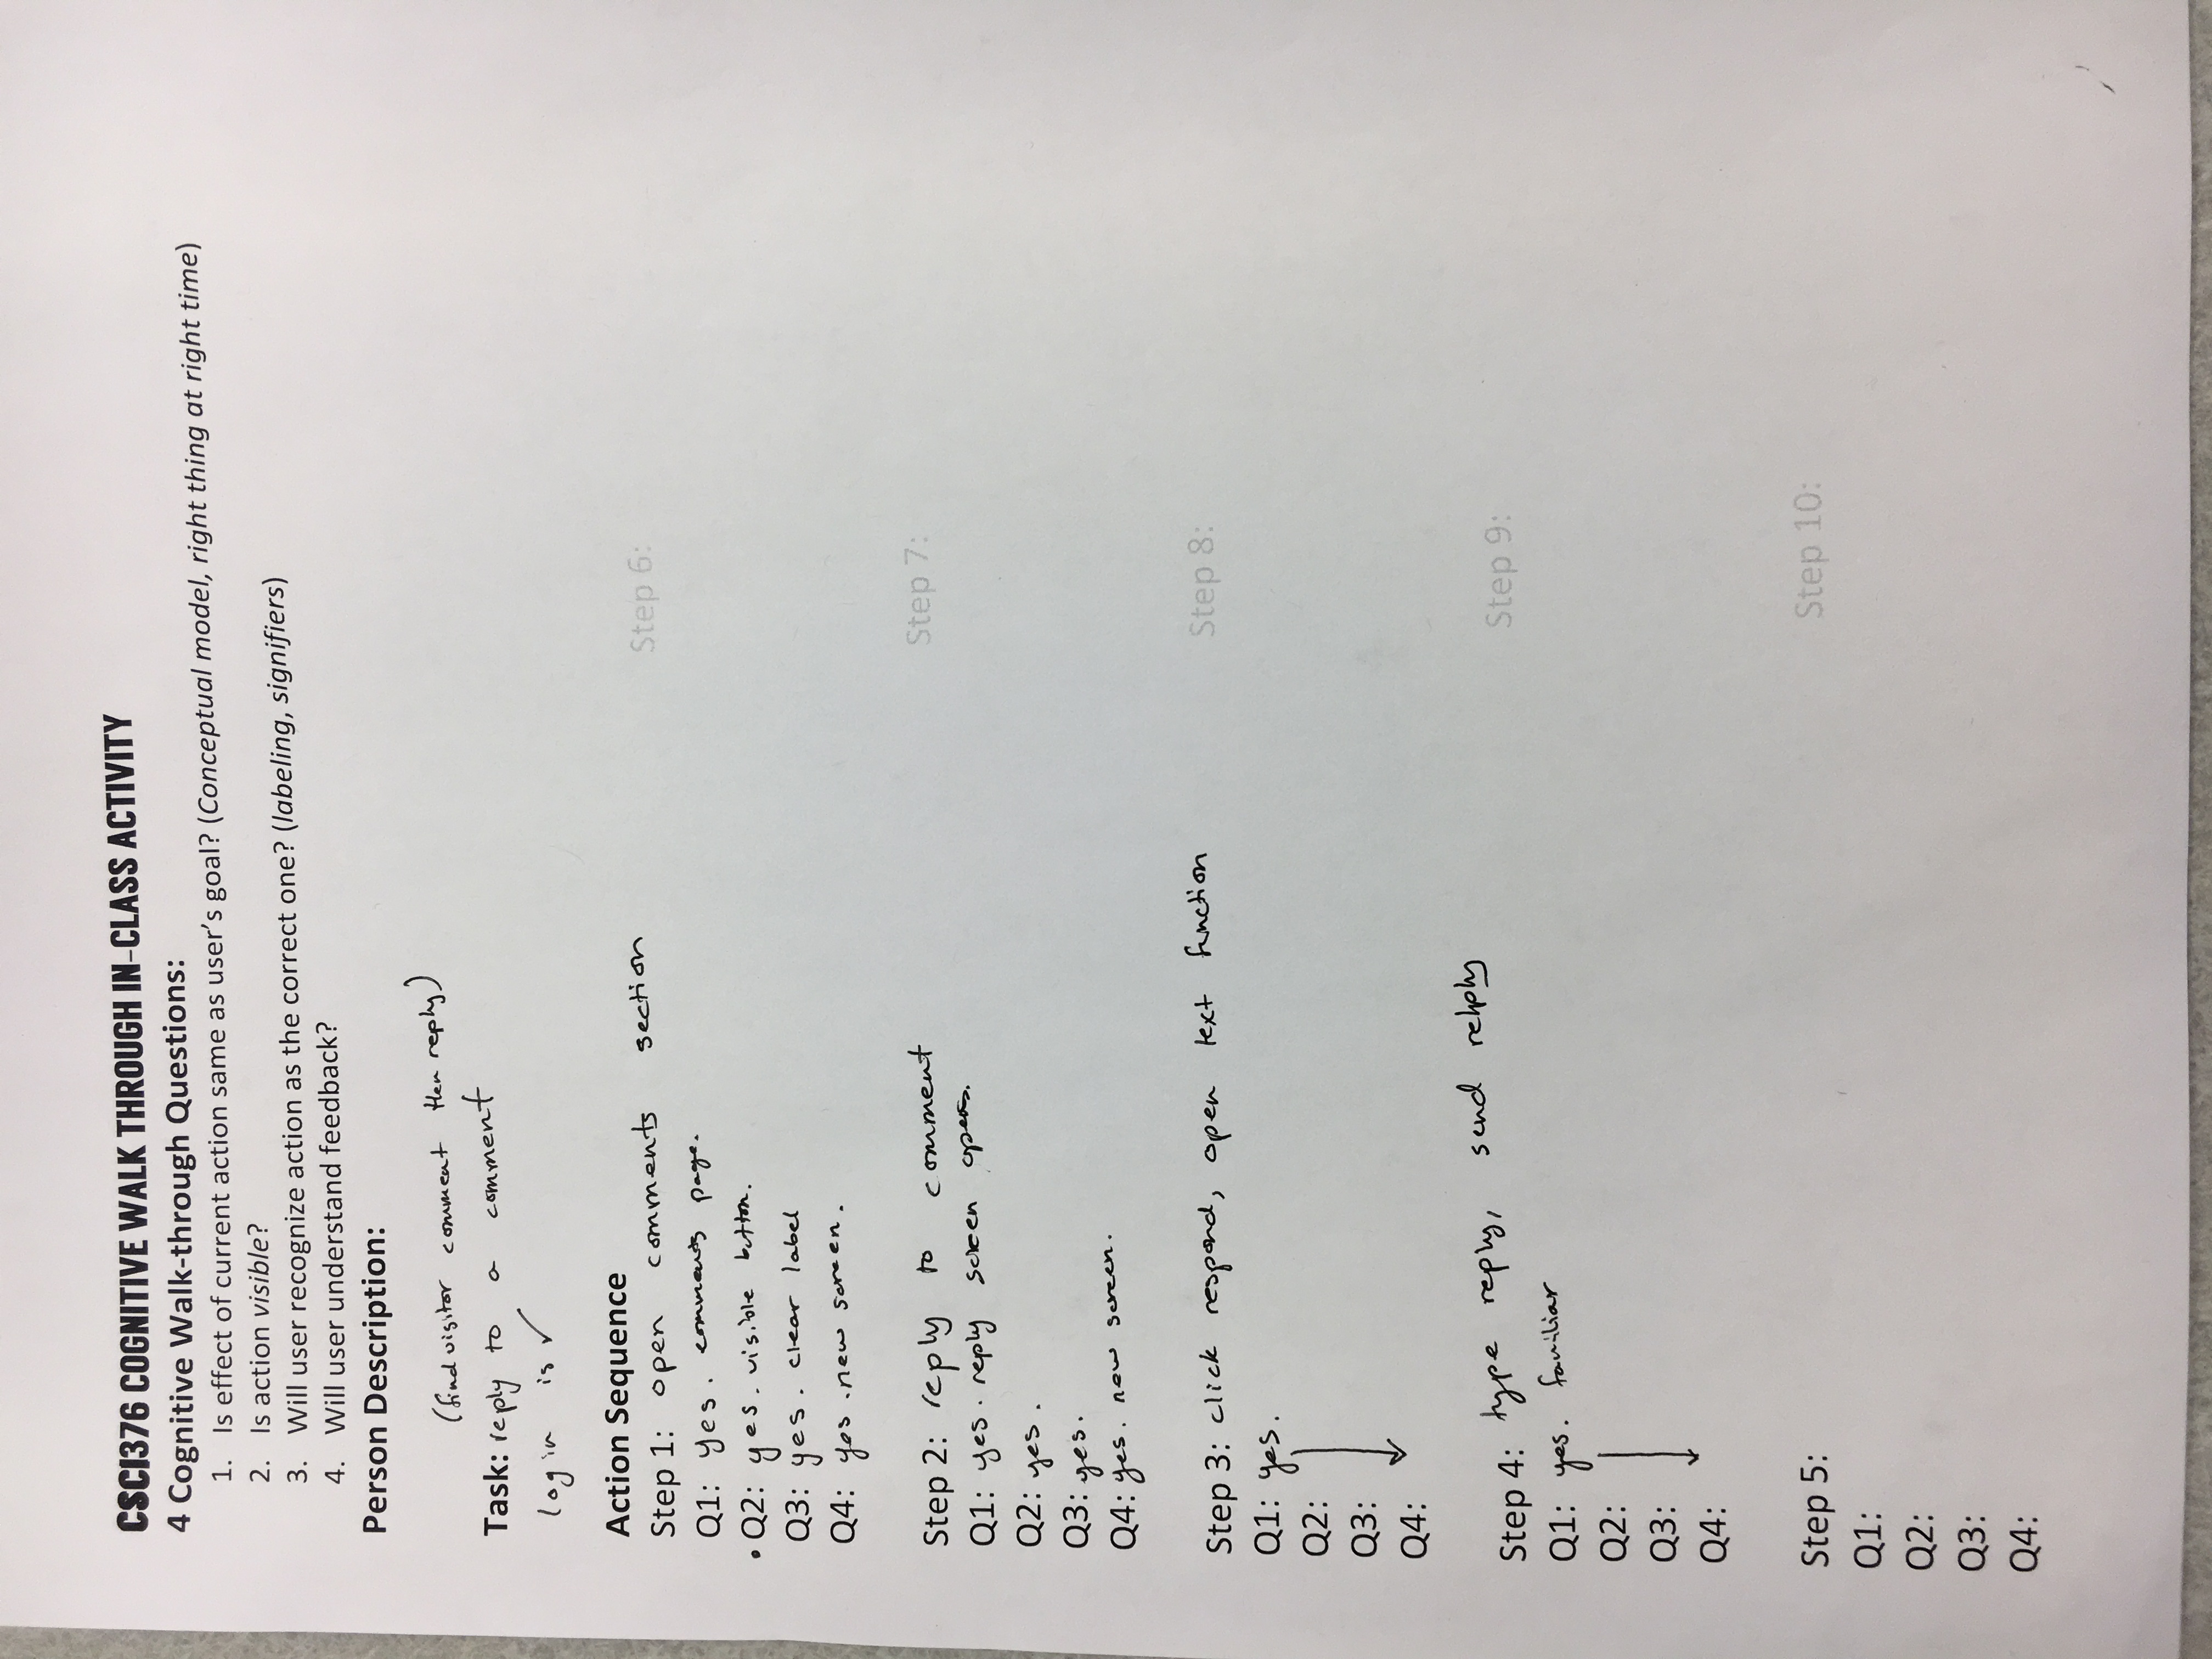
The second step in our testing process was a cognitive walkthrough that we completed in class. Our cognitive walk-through proved to be relatively unexciting because our hueristic evaluators were quite attentive to issues. A lot of their feedback fixed problems that otherwise would have come up in the walkthrough. We also may be too close to the project, because we weren’t able to come up with issues as we walked through the app. It may have been useful to do a cognitive walkthrough with an outside perspective. After our cognitive walkthrough, we decided to be more specific about the tasks we presented to people in order to help them navigate the paper prototype (discussed more in the “testing results” section). Here is our completed cognitive walkthrough worksheet from class:
The final step in our testing process was three usability tests. The first was with a Williams student who did not know a lot about art. We had UT1 walk through more specific but artificial versions of our tasks: 1) try to find analytics information about specific artwork, 2) try to respond to a message from a museum visitor. Even though we realized these were very artificial tasks, we still gained some useful insights. In particular, UT1 walked through their thought process while navigating our design, and pointed out multiple buttons that were still unintuitive (to them). We were then able to iterate our design based on this feedback before moving on to UT2.
The second usability test was with an Art History professor who specializes in African art. We explained the concept of simulating an actual application, emphasized the importance of thinking aloud, and described our tasks. The tasks we presented UT2 with were 1) find exhibit analytics, then artwork analytics, and 2) communicate with a museum visitor. However, UT2 quickly began clicking through the interface and asking questions about our data visualizations (e.g. what is the role of your data visualizations in this design?). We decided to answer these questions and let her continue with the usability test in this free pattern (instead of restricting her to our tasks). Even though this became more of a discussion about further functionality that might be useful, we were still able to get some feedback about more intuitive navigation structure (in retrospect, allowing this freedom made it hard for us to focus UT2 on our tasks, so this was probably a mistake). Additionally, the ideas we received about other functionaity would have been more relevant if we had more time to implement them. However, due to these time limitations, we decided to only implement the navigational changes.
The third usability test was with a WCMA curator. Here we tried to combine the two approaches in our previous usability tests (since one was a little too structured and the other wasn’t structured enough). We first explained what we were trying to accomplish in our design by generally explaining our two tasks: 1) allow curators to get a better understanding of their visitors by providing more information about visitors’ behaviors and feelings towards certain exhibits/artwork, and 2) allow curators to communicate with visitors by giving them the ability to answer questions directly. We then let UT3 traverse our design freely in an attempt to accomplish these tasks. We found that this was a good combination of the first two usability tests as it focused on the specific tasks we wanted, but didn’t restrict UT3 to artifical actions. The feedback from this test was crucial since it gave us specific information on the types of graphics we should be displaying, as well as ways to make our design more fluid.
Additionally, more detailed information about these users and this process can be found at the top of our usability review page.
We received a lot of feedback about our design, mostly regarding unclear buttons, labels, information, etc. From our perspective it was clear what everything meant, but as we’ve discussed, we are not our users. After having people with an outside perspective analyze our design, we realized how many different aspects were unclear. A list of our findings and our solutions are summarized in the table below:
| Where Problem Occurs | Broken Heuristic | Problem | Severity | Solution | |
|---|---|---|---|---|---|
| Home Screen | Mapping and Metaphors | “Comment” icon on home screen is confusing | 3 | Add text to icon (call it comments) | |
| Home Screen | Recognition, not Recall | Not clear what category “all feedback” and “comment” buttons are under (need title similar to “Current Exhibit Analytics” that we use in bottom half of screen) | 3 | Add title | |
| Questions and Suggestions Screen | Simple and Natural Dialogue, Consistency | Not sure which questions and suggestions have already been answered | 2 | Add some indicator (like greying out of question) to show it has been answered. Also show previous answers, when curator clicks on a question. | |
| Questions and Suggestions Screen | Consistency | Too much if all questions and answers are shown. It’s a little overwhelming. | 2 | Add a filtering system: categorize by keywords, or have them search for keywords. Exhibit, type of question, type of suggestion, etc. | |
| Questions and Suggestions Screen | Consistency | Unclear on how to respond to questions. Click on the actual question or the reply button? | 1 | Perhaps have a “reply” button instead of the arrow so that it can be clearer. | |
| Ignore/Answer Questions Screen | Error Recovery | No undo button if user accidentally hits ignore on a question (assuming it goes away) | 1 | Perhaps add an undo functionality. Decided comments don’t get deleted. Can now search by “ignored” | |
| Data Visualizations | Simple and Natural Dialogue, Consisteny | Data viz is unclear, no label. It’s not specific about what it’s showing, and is a bit overwhelming. | 3 | Put titles in every visualization as well as labels to indicate what that means. Perhaps a help button. Implemented labels to start. |
Additionally, more detailed information about our revisions can be seen in our heuristic evaluation page.
As mentioned above, since we may have known, a little too well, how our design worked, it was hard for us to find faults during our cognitive walkthrough. Additionally, the changes made from the heuristic evaluation removed a lot of ambiguity in certain locations. This led to a fairly unexciting cognitive walkthrough. However, we did realize that our tasks were a little too ambiguous, so we tried to make them more specific: revised task one was to find exhibit and artwork analytics, and revised task two was to respond to visitor questions. As we will discuss more below, we found that these tasks became a little too specfic and superficial.
As we mentioned in the “testing process” section above, we gained a lot of significant feedback and insights during the usability tests. One insight, in particular, was that our tasks did not adequetely represent what we were trying to do. Our original tasks were too broad and our current tasks were too specific and atificial (as described above, we realized this through our usability tests with U1 and U2). However, by the time we did the usability test with U3, we had narrowed our tasks appropriately: 1) allow curators to get a better understanding of their visitors by providing more information about visitors’ behaviors and feelings towards certain exhibits/artwork, and 2) allow curators to communicate with visitors by giving them the ability to answer questions directly. These tasks seemed to be specific enough as to describe what we wanted; however, they do not artifically split our design into fixed steps.
Additionally, through all three usability tests, we also received a lot of feedback to make our design much more intuitive to use. A list of our findings and solutions (from all three tests) are summarized in the table below:
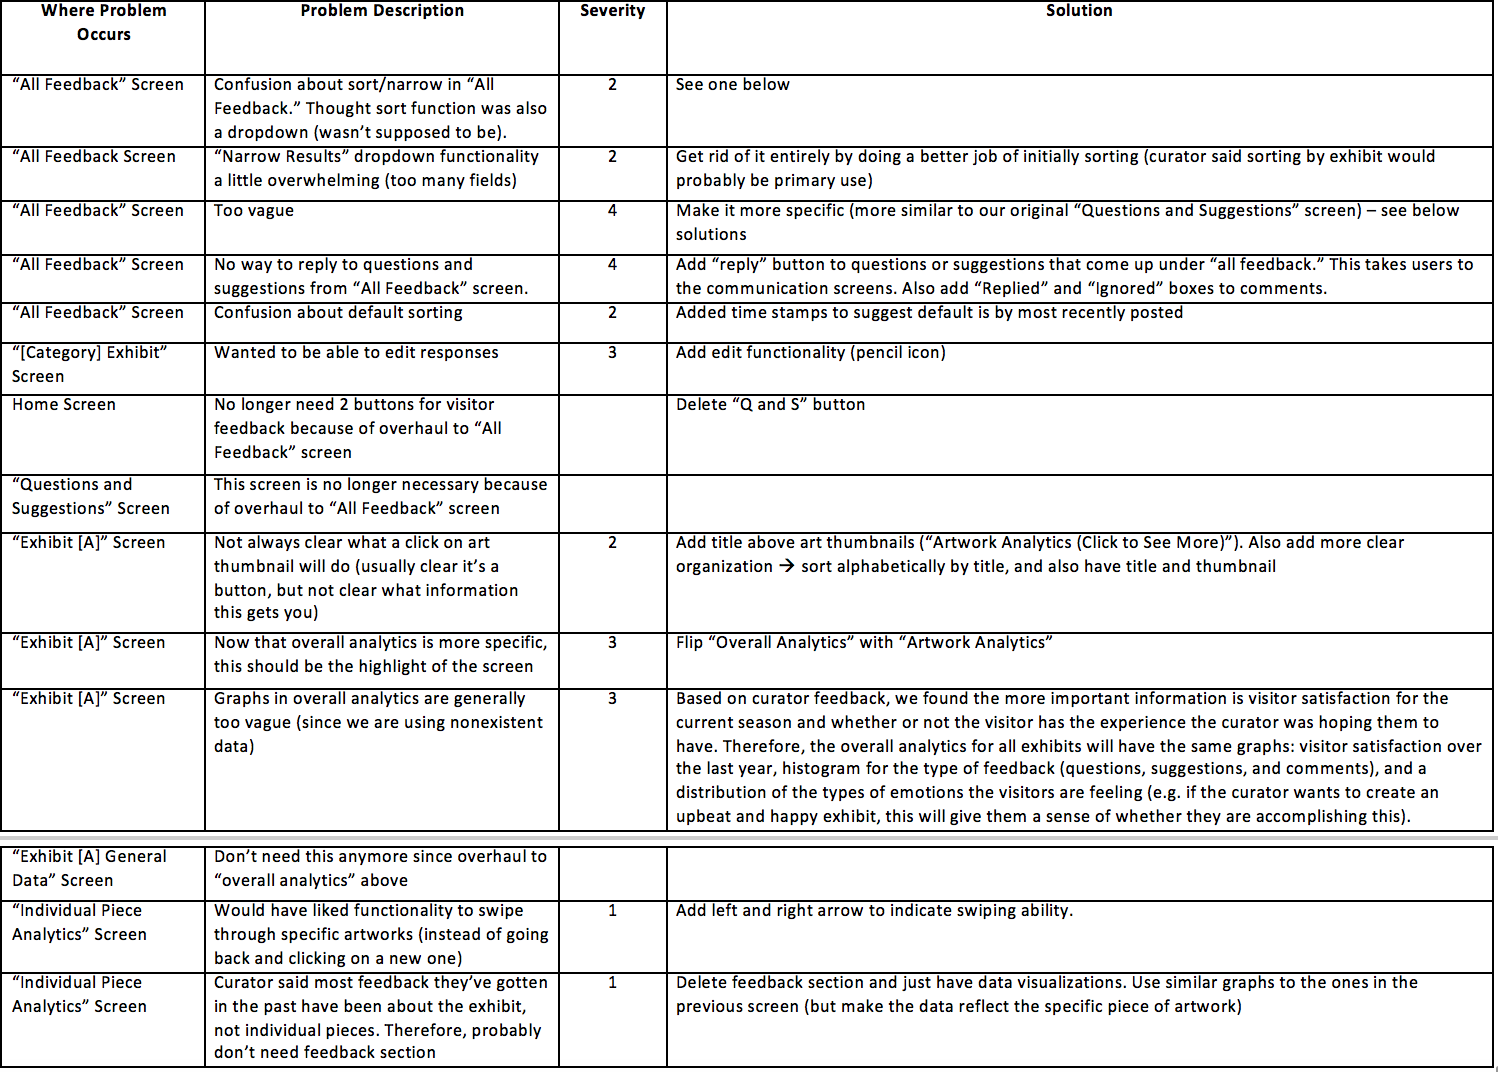
Since the above table gives an overview of our changes and the “testing process” section illustrated the types of feedback we received from each usability test, we will not go into further detail here. However, more information about the specific feedback from each of the three users can be found in our usability review page.
Here is an overview of our final paper prototype. We made some major changes since our intial version. These changes include scrapping the home screen, the questions and suggestions screen, and the general data analytics screen. Additionally, we did major updates to the exhibit analytics and all feedback screens. We also made minor edits to the individual piece analytics and response preview screens. Finally, the response screen remained unchanged (this is probably because it is a simple chat function which was relatively intuitive to the people who performed tests for us). A summary of the changes can be found in the table above, while detailed informaiton and images of the screens that were changed can be found in our usability review page.
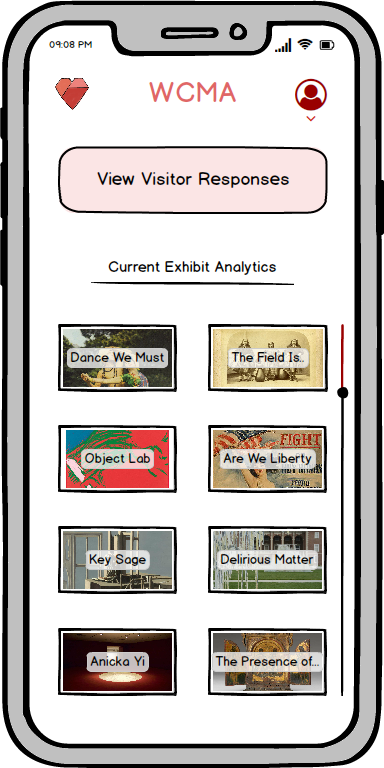
Since we deleted the log-in screen, the user will start on the home screen. Similarly to our initital prototype, this is the main hub where curators can begin their navigation towards either of our main tasks (but now our tasks have been revised). The first path allows them to view data based on the exhibits and artwork (bottom half of screen) while the second path allows them to communicate directly with museum visitors (top half of screen). More detailed information is discussed in the task walkthroughs.
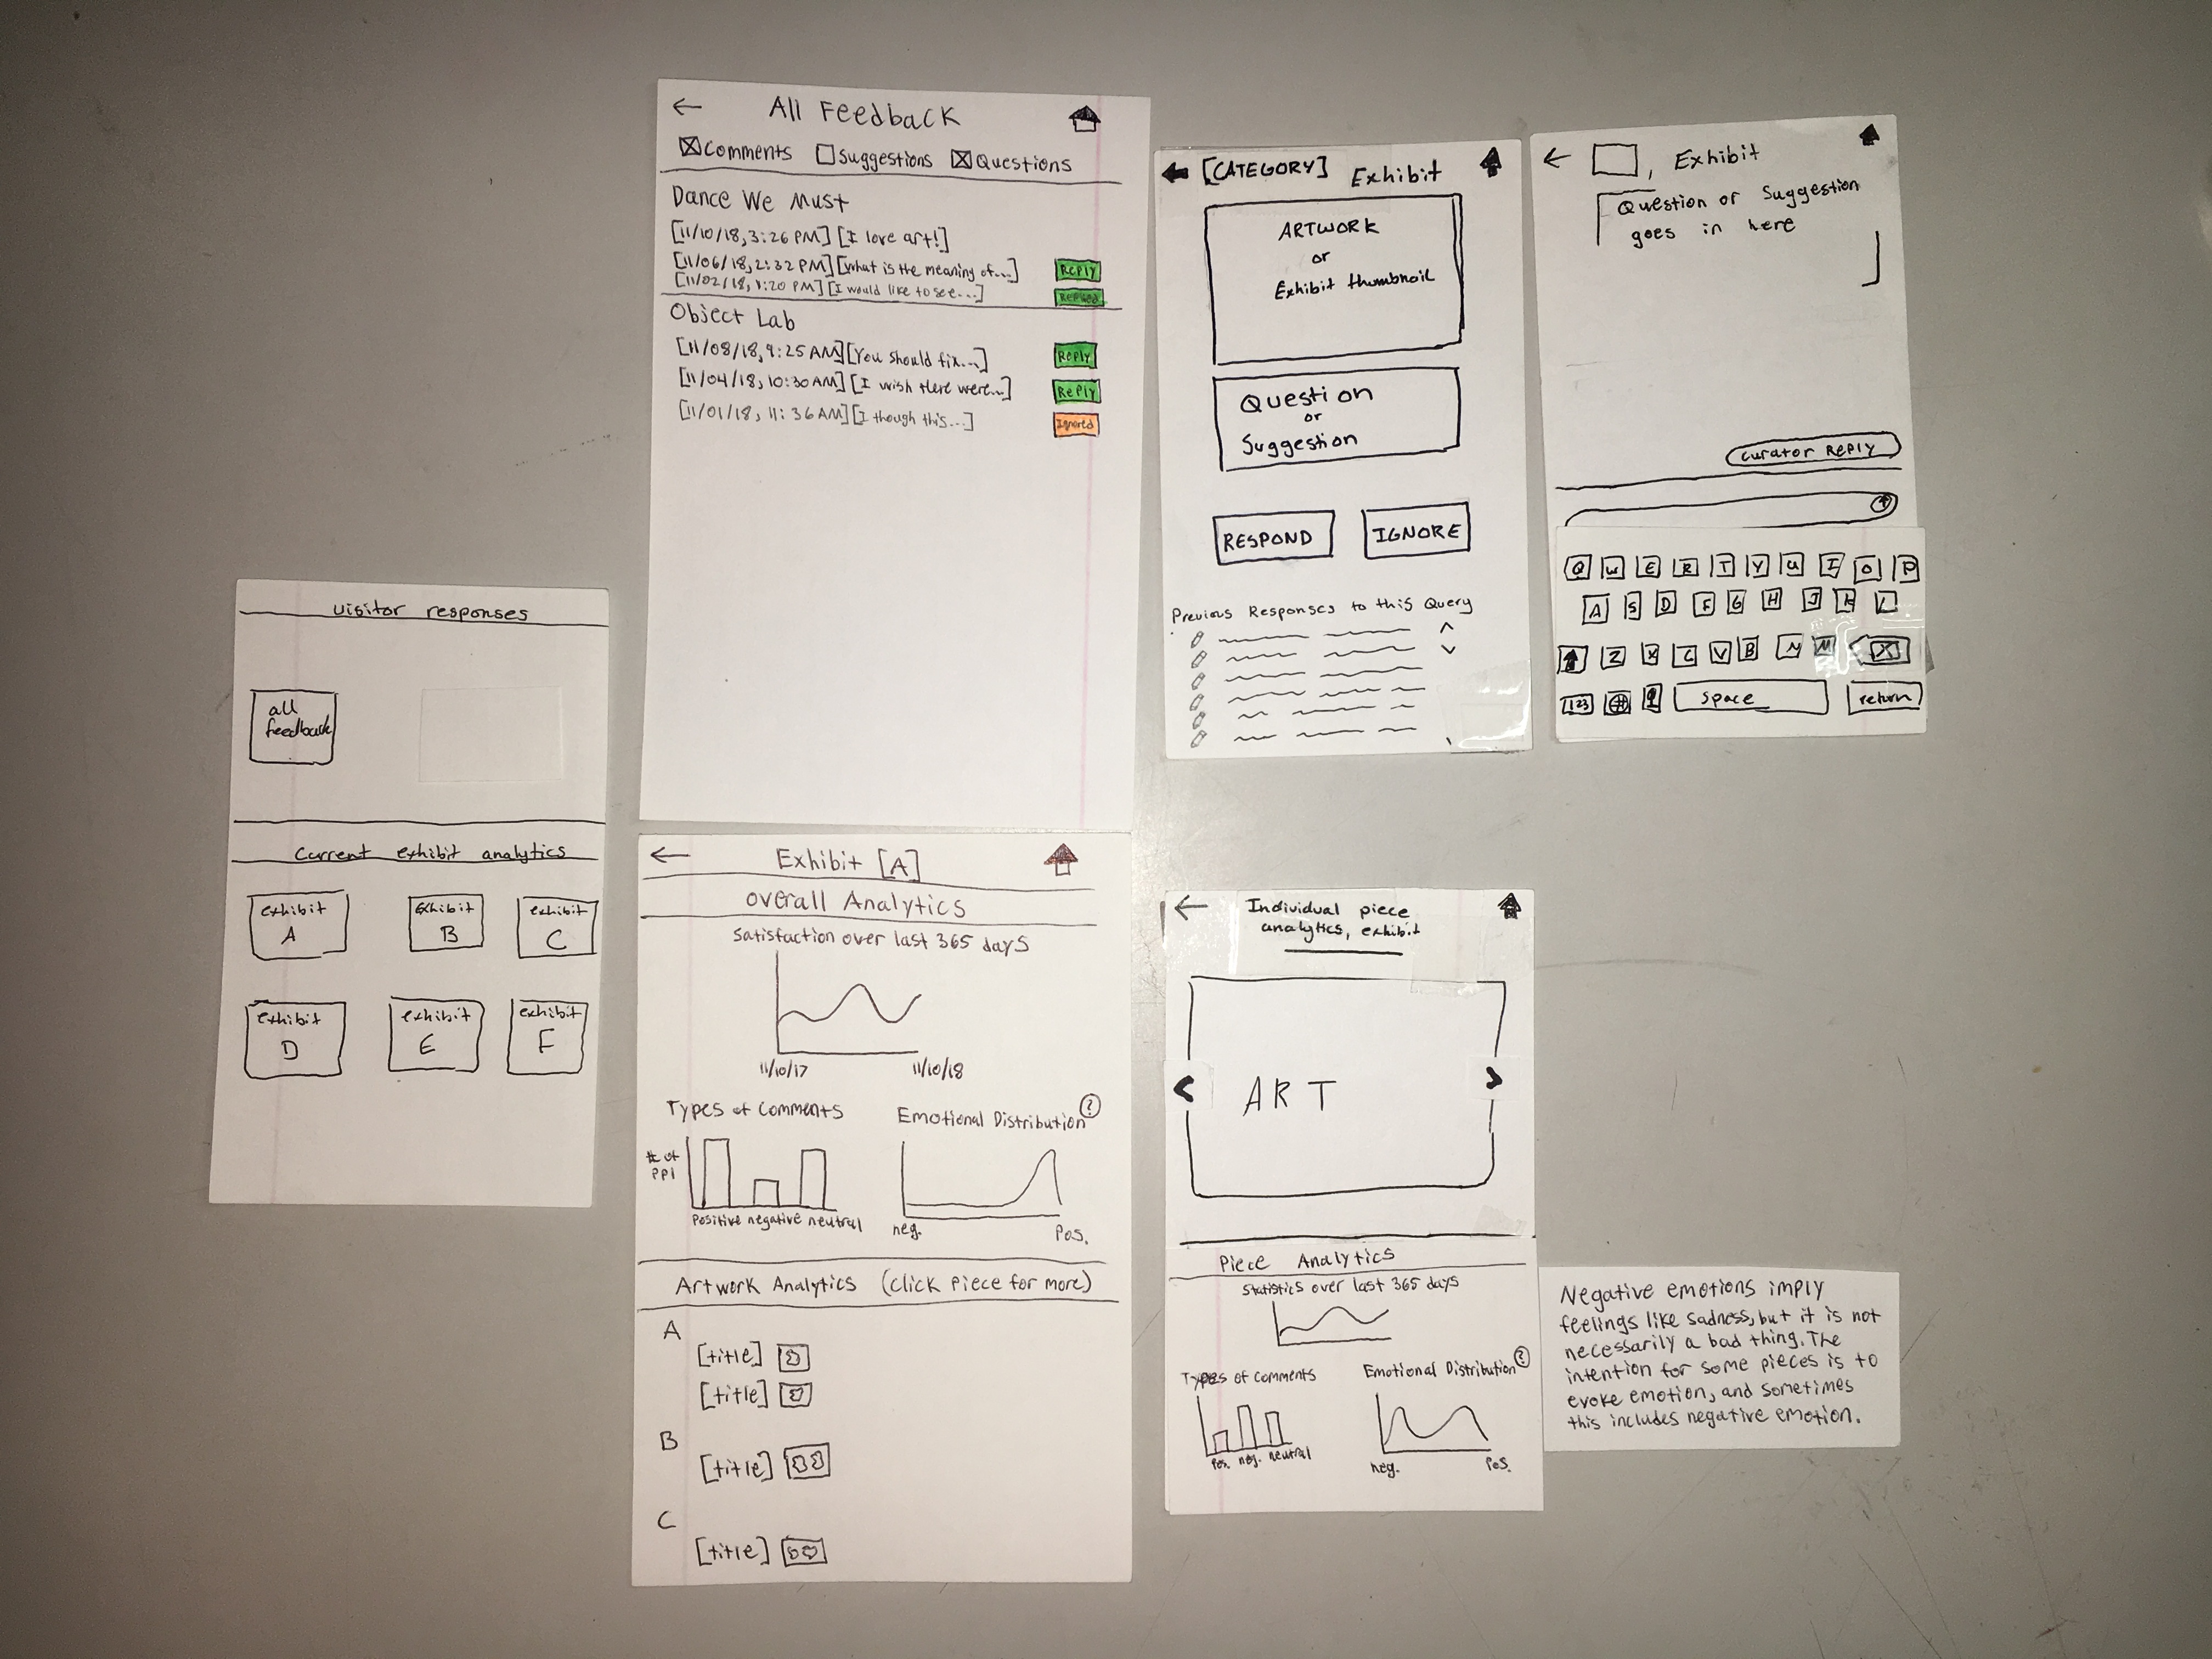
The user starts at the home screen.
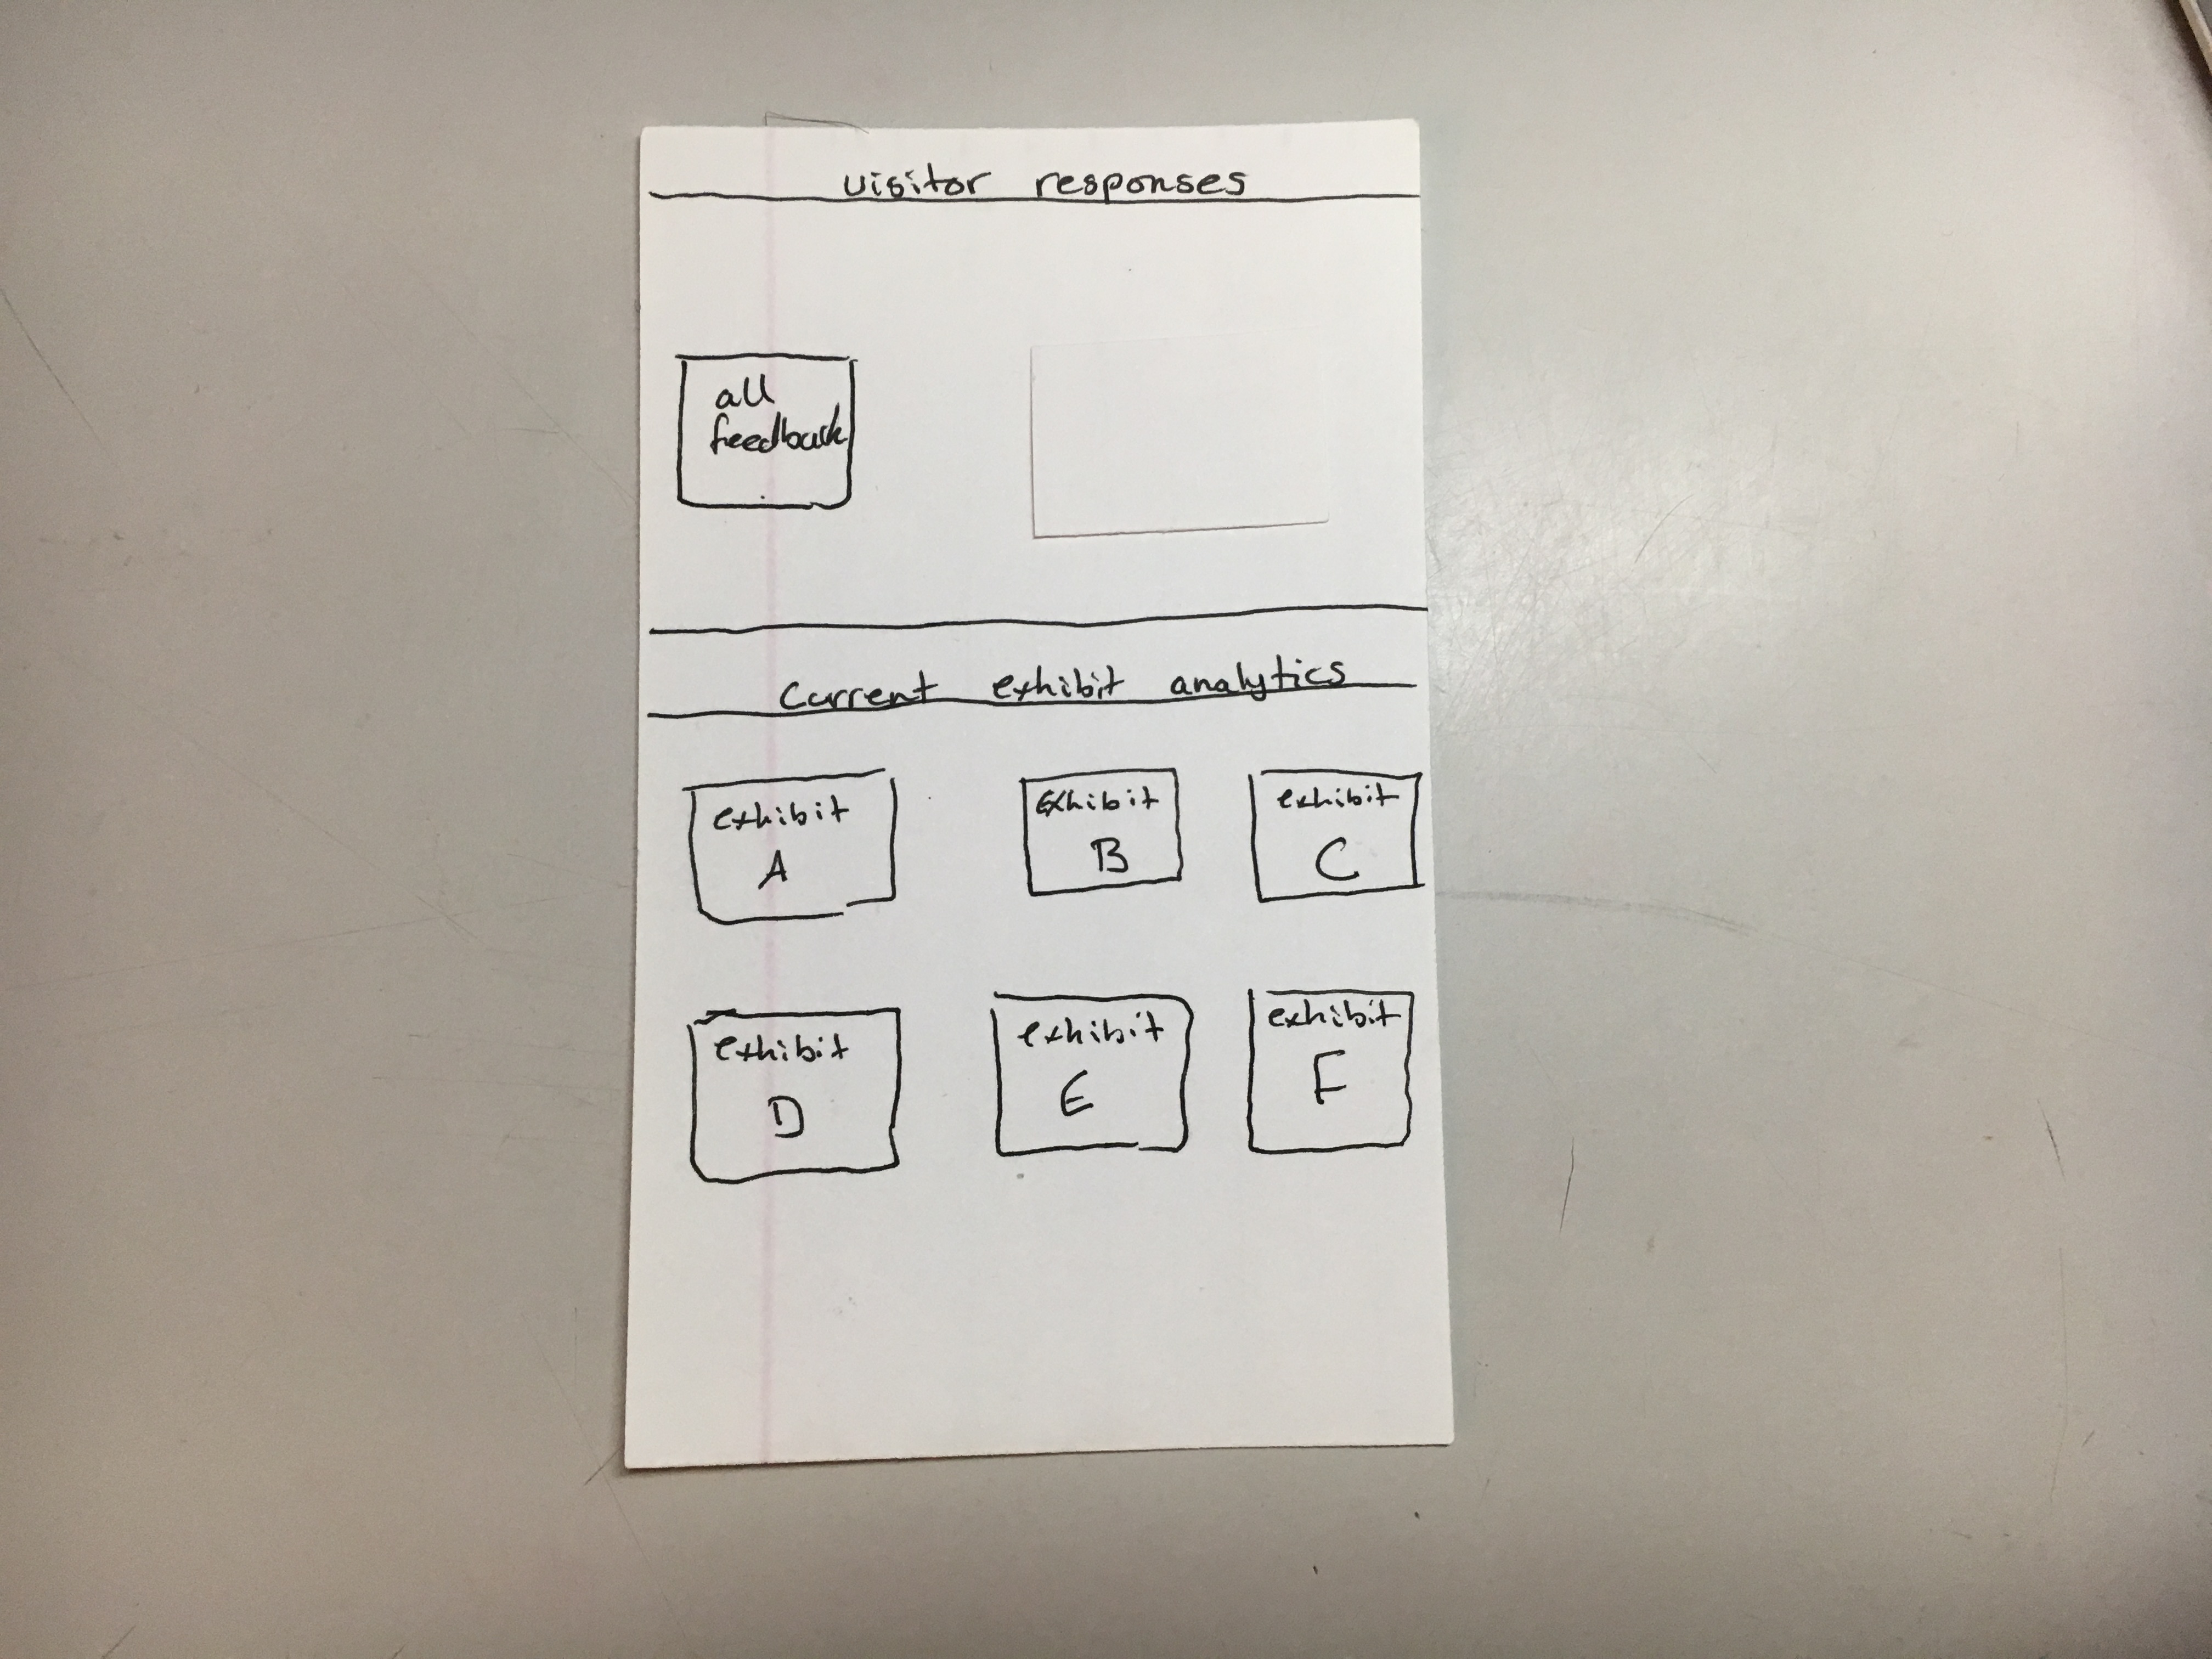
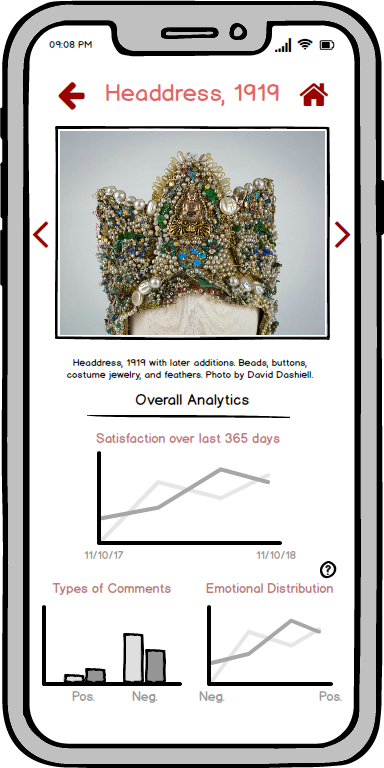
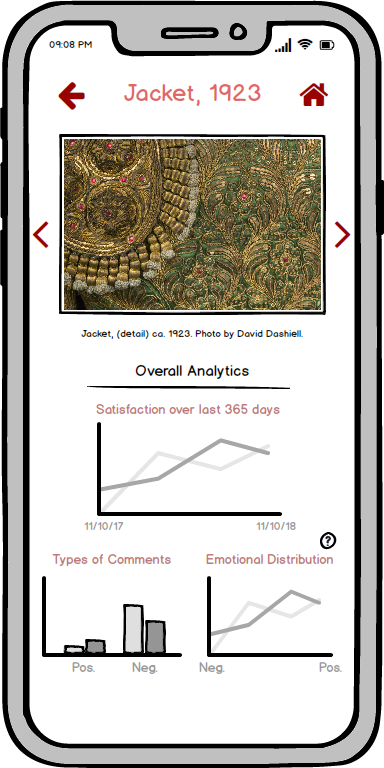
They then have a couple options from here: click the all feedback button, or click one of the exhibits listed on the bottom half of the screen. Let’s say they click one of the exhibits. They will then be taken to the analytics for the exhibit they clicked, showing both the overall analytics for the exhibit and an alphabetically organized set of the artwork in that exhibit.
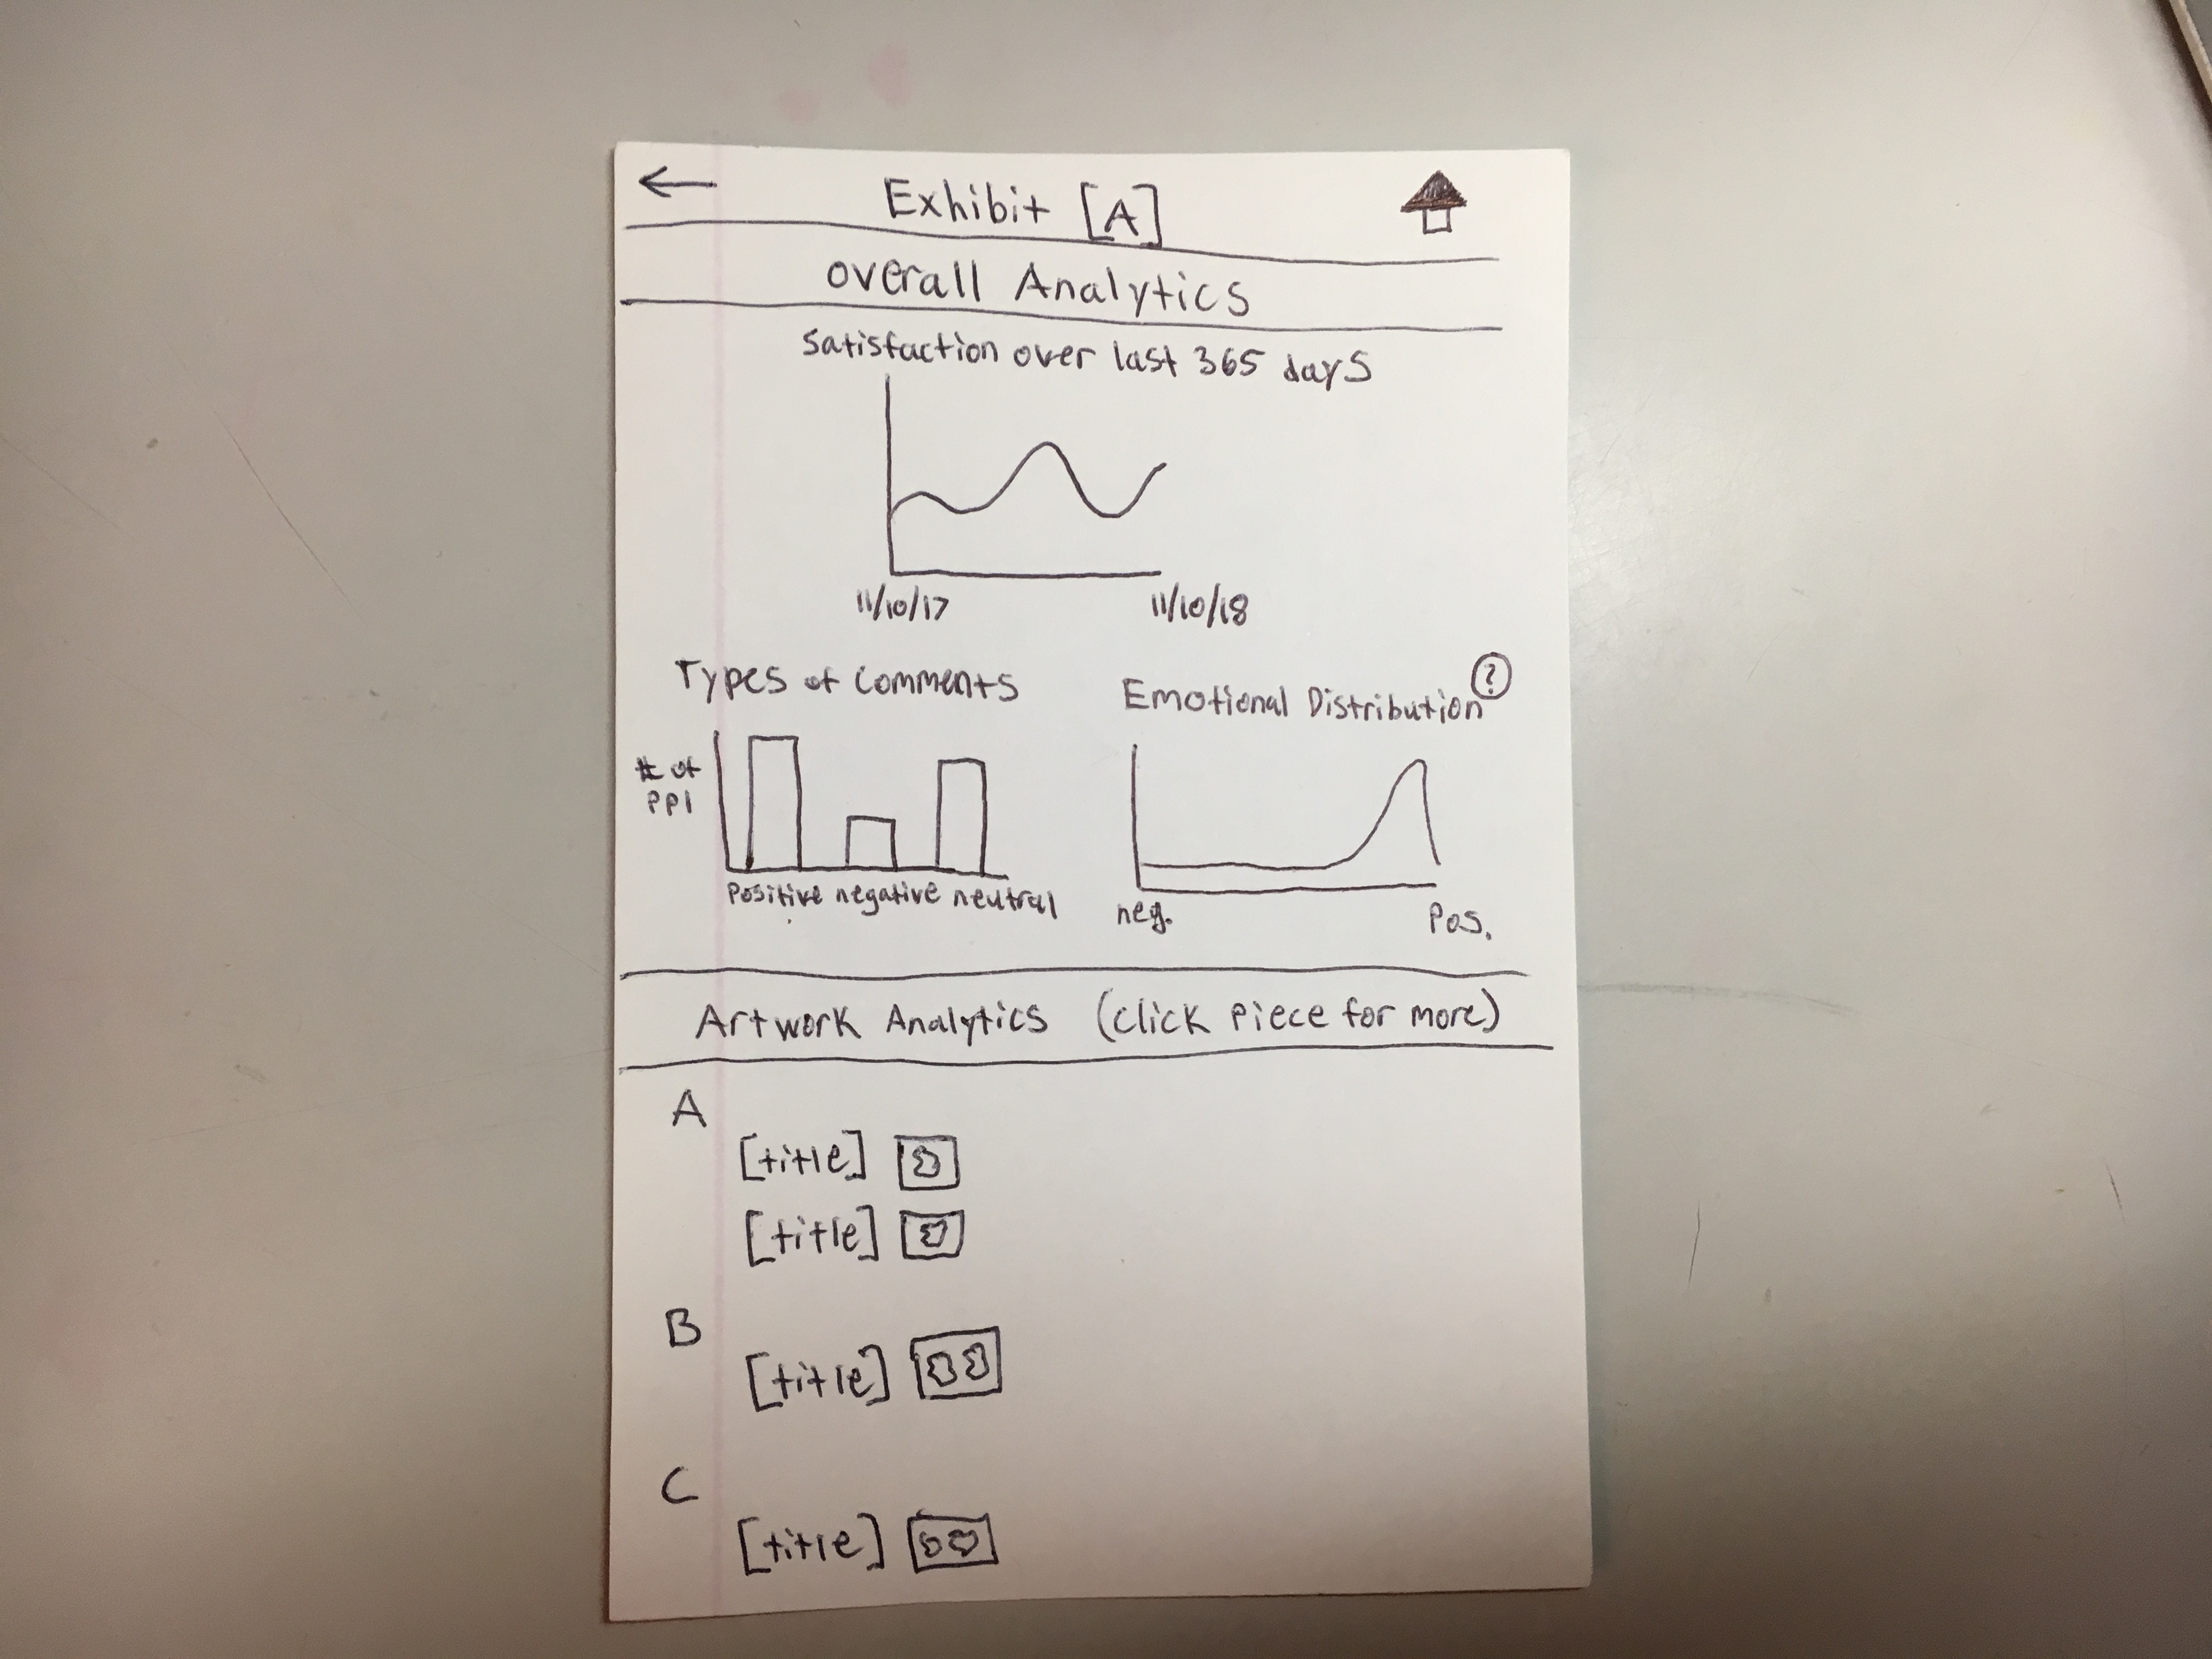
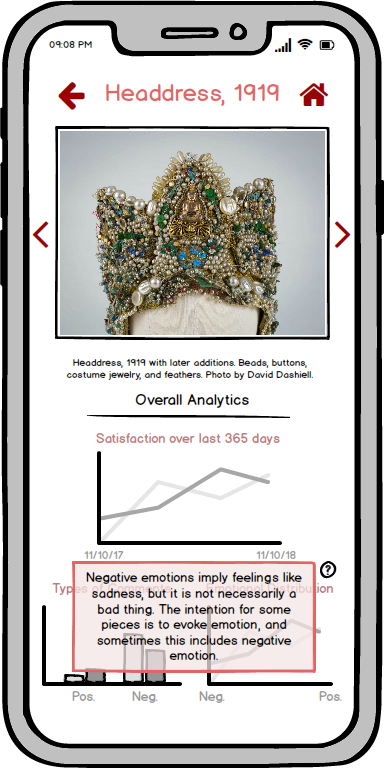
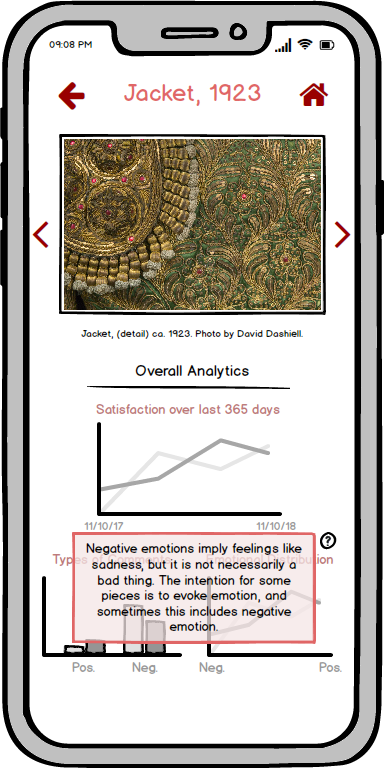
The graphs from the overall analytics are based on what we found are the most important and feasible pieces of information (feasible based on assuming we have visitor feedback data available, and important based on discussion with a curator). Now, if a user clicks on a specfic peice of artwork, they will then be taken to the artwork analytics page which shows the piece of art, and the same graphs, except using data for that specific piece work. Additionally, the emotional distribution graph might be confusing since negative emotion may seem like a bad thing, so there is a help button to explain that this might not be the case.

Now let’s assume the user clicks the home button to get back to the home page.
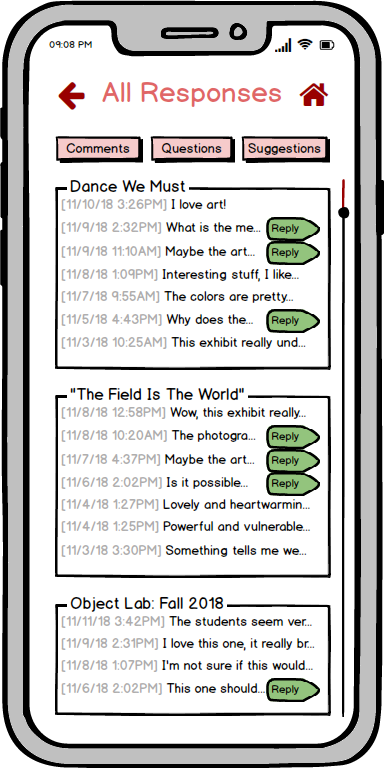
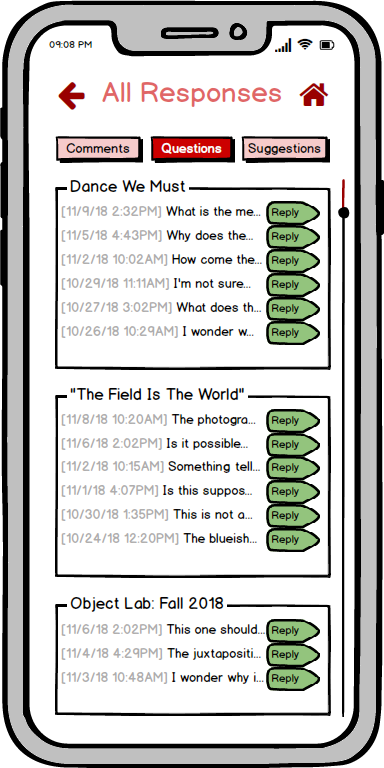
If they click the all feedback button, the user will then be taken to the “all feedback” screen, which will show them all visitor feedback from most recent to least recent, categorized by exhibit. We have also determined that there are 3 types of comments: questions, suggestions (not a question, but comment implies that action should be taken), and general comments (comments that don’t imply action should be taken). The user can then click one of the checkboxes in order to make certain types of questions appear or disappear based on what they want to see.
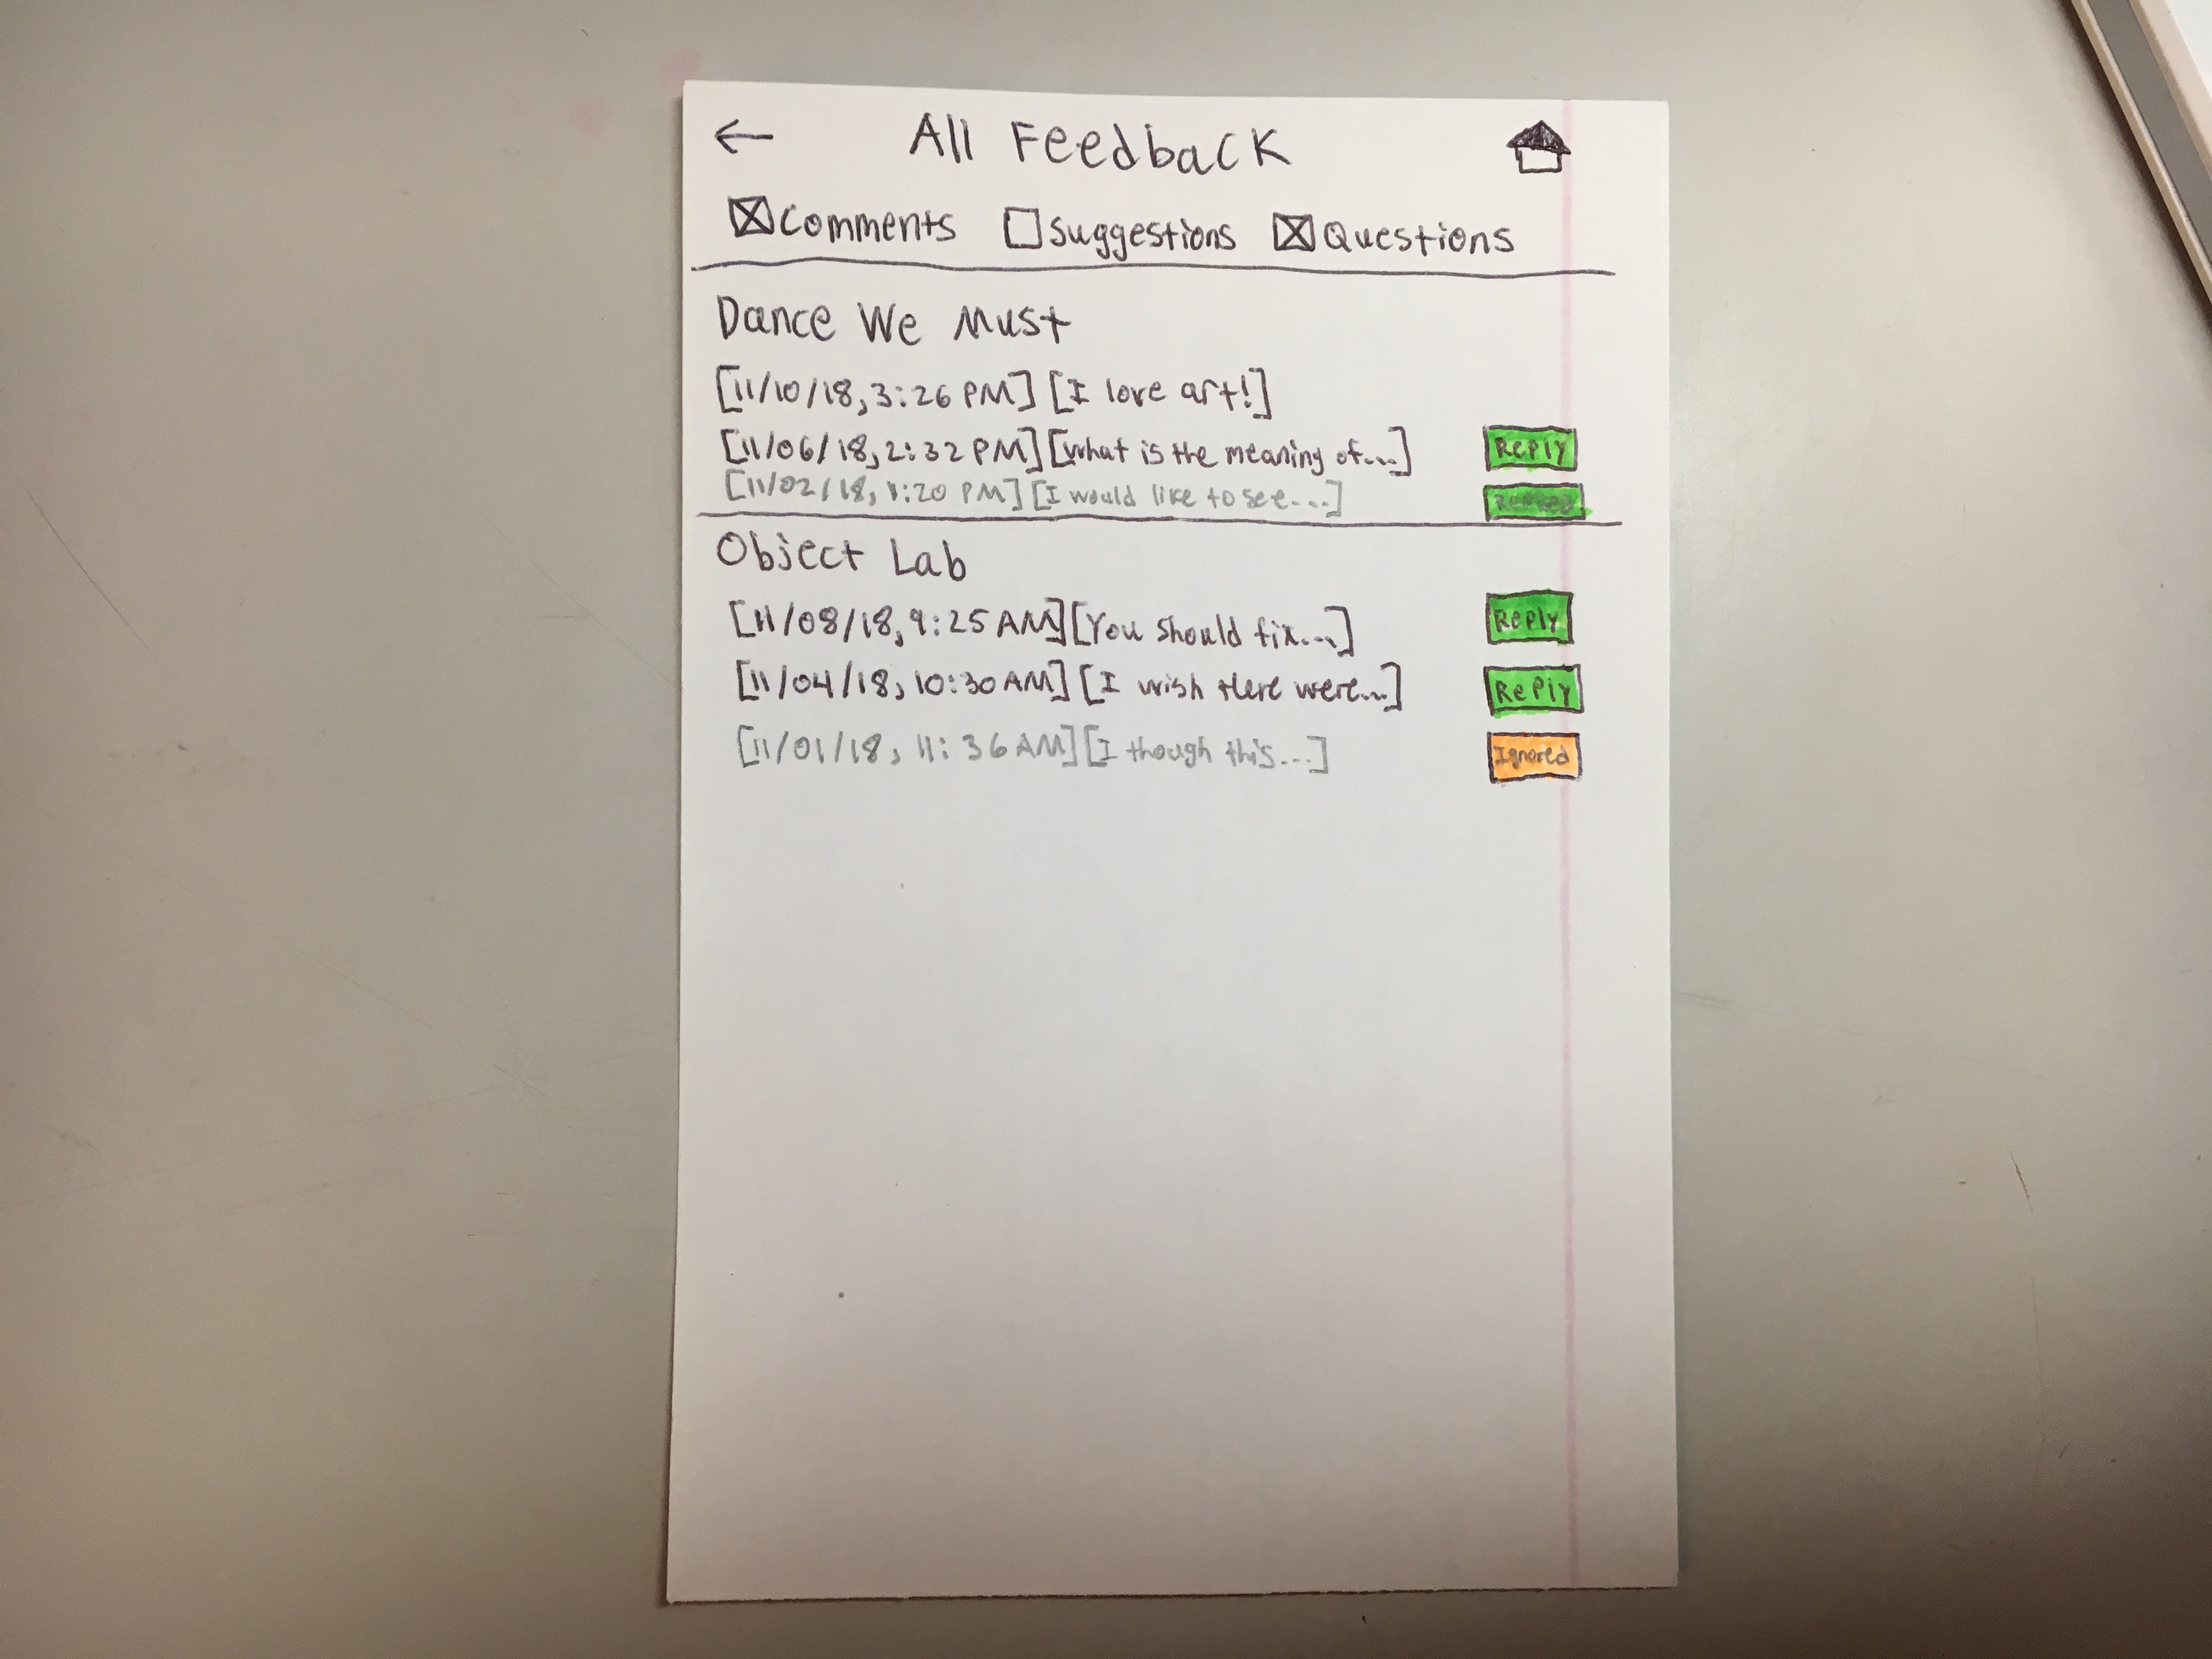
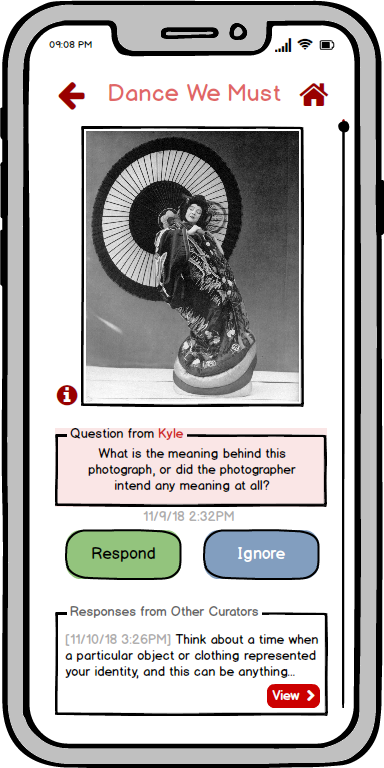
If a user wants to reply to a comment, they click reply (“ignored” and “replied” are also still clickable, and take you to the same screen). They will then be taken to a response preview screen where they can see the exhibit/artwork and the full question. The curator can see responses from previous curators, edit those responses, ignore the question (which will mark the question as ignored), or respond to the question.
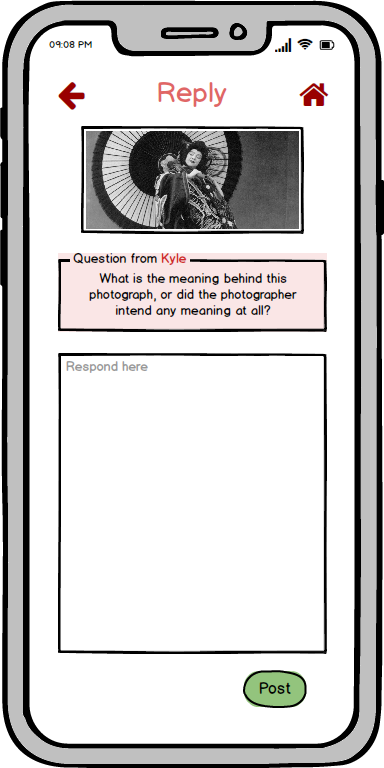
The user can then click respond to open the response screen, allowing them to type and submit their response.
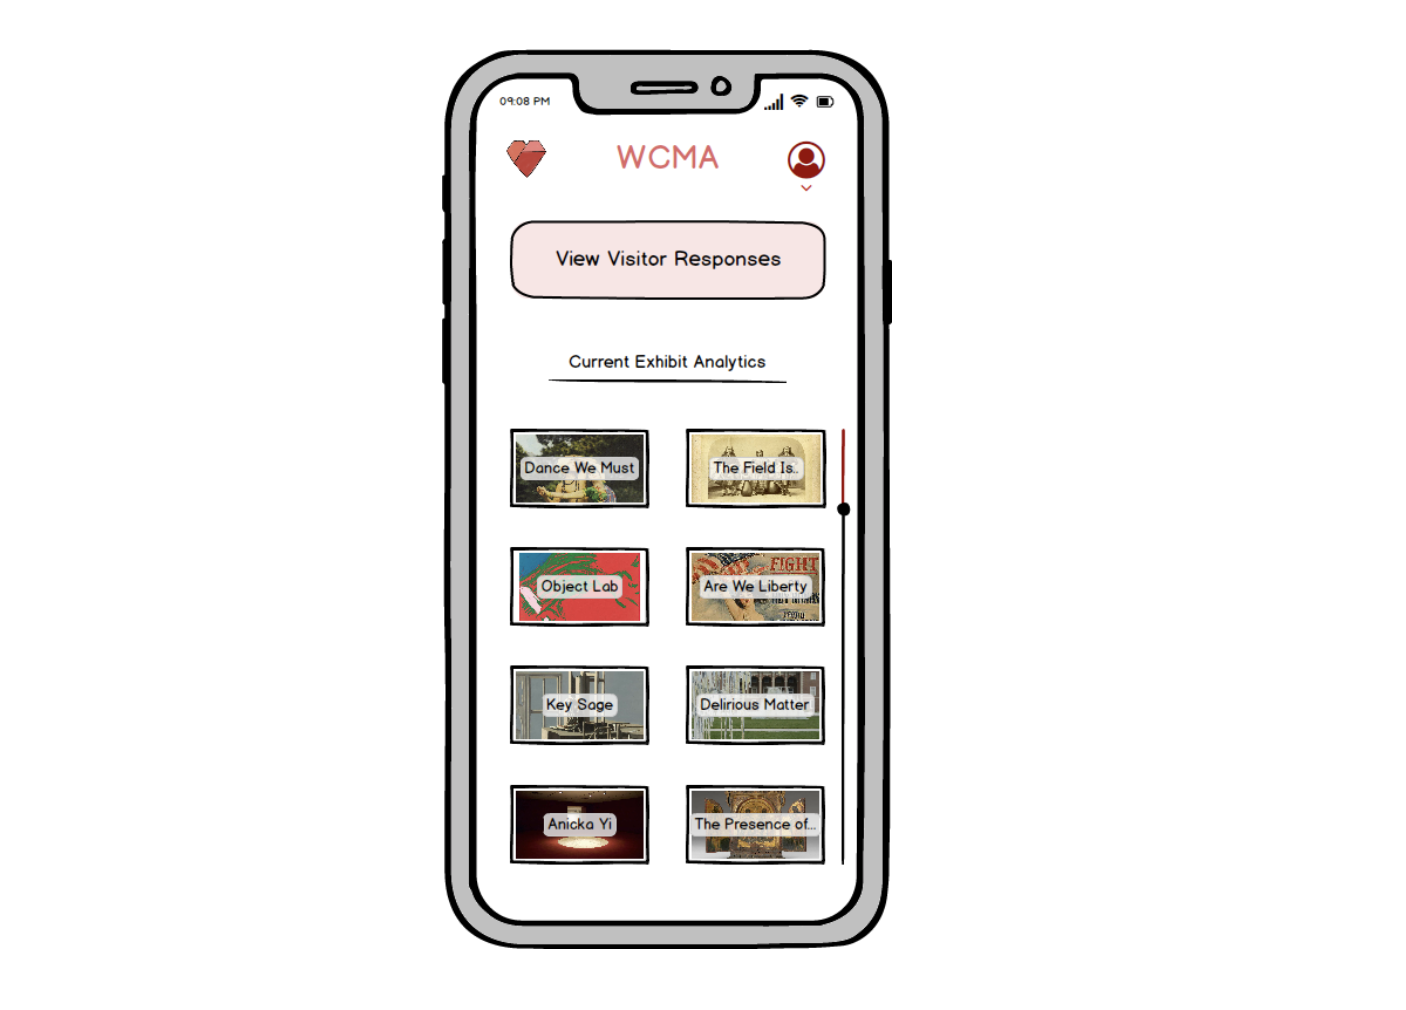
Overall, our digital mockup is fairly consistent with the final paper prototype. However, one main difference is that we decided to leave in a login screen and added a home page profile button. When curators respond to questions, it is probably important to know which curators responded to which questions. Therefore, we decided to show that accounts for each curator should exist so that responses to questions are a little more personal (in contrast to being anonymized). This way visitors know which curators answered their questions and can ask these specific curators if they have further questions (we mentioned this idea to UT3 and she said she liked it). We also made the questions and descriptions throughout the design more specific in order to have a more realistic feel. Additionally, we added a confirmation popup to curator replies to questions (just to make the submitting action more explicit), and also (based on feedback), made the shade of red in our interface darker.
Aside: since our task walkthrough not only shows how our design supports each of our tasks, but also clearly conveys screen transitions, we will leave out the overview of screens from this section. However, the complete contents of our digital mockup deliverable can be found here. Additionally, our the task walkthrough here will be very similar to the one found above for the final prototype in order to show the consistency between the designs.
The user starts at the home screen. They then have a couple options from here: click the all feedback button, or click one of the exhibits listed on the bottom half of the screen. If they click one of the exhibits, they will then be taken to the analytics for the exhibit they clicked, showing both the overall analytics for the exhibit and an alphabetically organized set of the artwork in that exhibit.
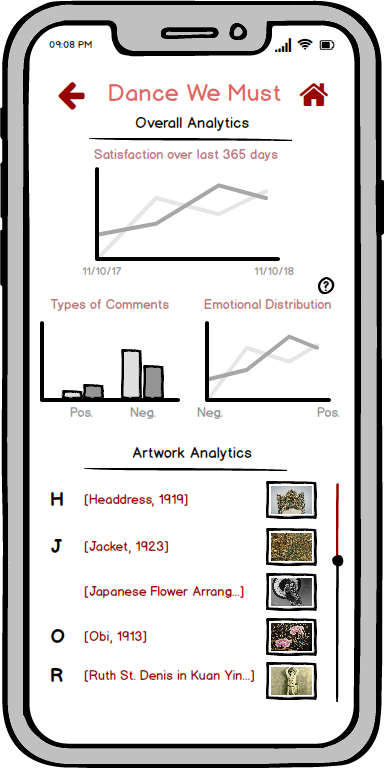
The graphs from the overall analytics are based on what we found are the most important and feasible pieces of information (feasible based on assuming we have visitor feedback data available, and important based on discussion with a curator).
Now, let’s say the user clicks on a specfic peice of artwork. They will then be taken to the artwork analytics page which shows the piece of art, and the same graphs, except using data for that specific piece work. Additionally, the emotional distribution graph might be confusing since negative emotion may seem like a bad thing, so there is a help button to explain that this might not be the case.
Now let’s assume users click the home button to get back to the home page.
If they click the all feedback button, the user will then be taken to the “all feedback” screen, which will show them all visitor feedback from most recent to least recent, categorized by exhibit.
We have also determined that there are 3 types of comments: questions, suggestions (not a question, but comment implies that action should be taken), and general comments (comments that don’t imply action should be taken). The user can then click one of the checkboxes in order to make certain types of questions appear or disappear based on what they want to see.
If a user wants to reply to a question, they can click “reply” (“ignored” and “replied” are also still clickable, and take you to the same screen). They will then be taken to a response preview screen where they can see the exhibit/artwork and the full question. The curator can see responses from previous curators, edit those responses, ignore the question (which will mark the question as ignored), or respond to the question.
The user can then click respond to open the response screen, allowing them to type and submit their response.
The process of iterative design showed us that our ideas of solutions and what users need in solutions didn’t always align. We learned to listen to our users in order to find what they needed. We also learned that asking questions wasn’t as easy as it seemed at first. The wrong question could bring our conversation in an entirely unproductive direction. Targeted and tight questions would provide the answers we wanted but not the anwswers we needed, while open-ended questions provided us with too many ideas and information outside of our scope.
The usability tests caused our tasks to move from abstract to too specific, before we finally reached a good balance. During UT1 we realized that tasks which were artificial gave us narrow feedback that was too consistent with what we expected (it was too predictable). UT2 had too little structure, and two general tasks. Our tasks were refined by the final usability test. However, UT3 also wanted to engage with what information was collected and how, which was not part of our scope. Even though it took us awhile to create tasks that illustrated the scope of our design, we still received a lot of insightful feedback that made our interface much simpler. Multiple screens were deleted in the process, showing that we were probably trying to make things more complicated than they should.
In regard to our current design, it would have been nice to do more ideations with our digital prototypes because our “final design” doesn’t feel like it should be final. There were relatively major changes between our first and final interfaces, so it would have been better if we could have done tests on this final design to see if it is in fact what users want. With the specific details we have, such as actual feedbacks listed in the “All Responses” page, images from WCMA’s website to support our exhibit and artwork details, and fake but realistic graphs and charts, our product could received different, more specific responses from users. They could have commented on where buttons, icons, images, and data visualizations were placed, and their testing could have told us how much these functions stand out (as in they could have missed certain functions, like the help/info buttons). That way we could refine our prototype even more to have an effective, communicative design.