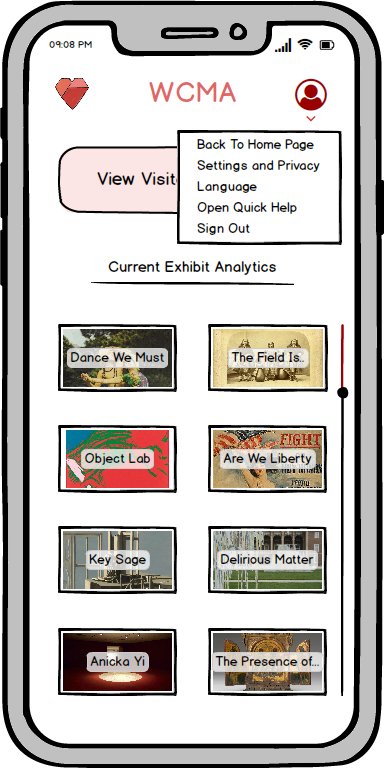
Overall, our digital mockup is fairly consistent with the final paper prototype. However, one main difference is that we decided to leave in a login screen and added a home page profile button. When curators respond to questions, it is probably important to know which curators responded to which questions. Therefore, we decided to show that accounts for each curator should exist so that responses to questions are a little more personal (in contrast to being anonymized). This way visitors know which curators answered their questions and can ask these specific curators if they have further questions. Additionally, we made the questions and descriptions throughout the design more specific in order to have a more realistic feel. We also added a confirmation popup to curator replies to questions (just to make the submitting action more explicit).
Overview
Detailed Images
Task 1 Find Exhibit Graphs/Analytics
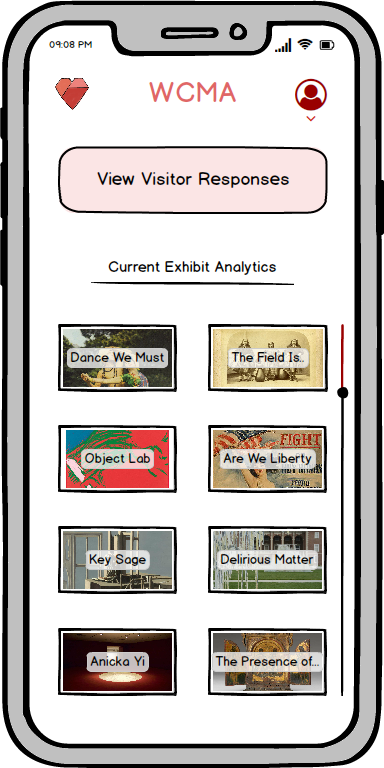
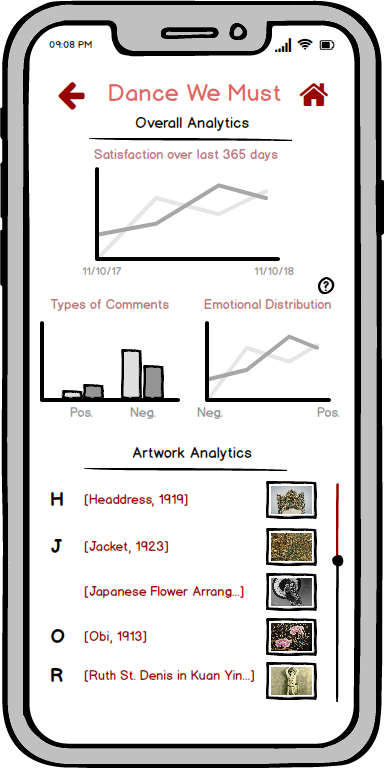
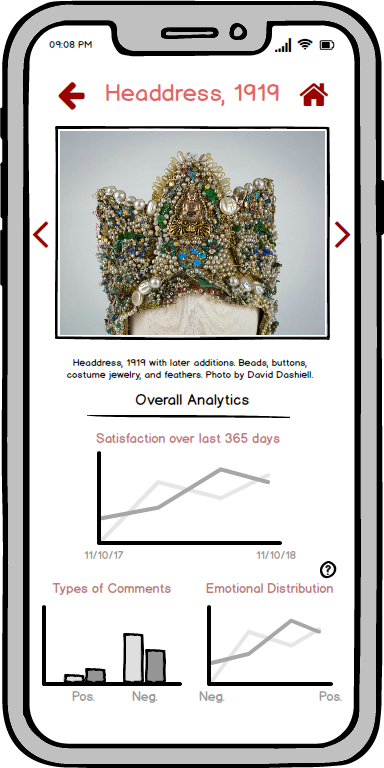
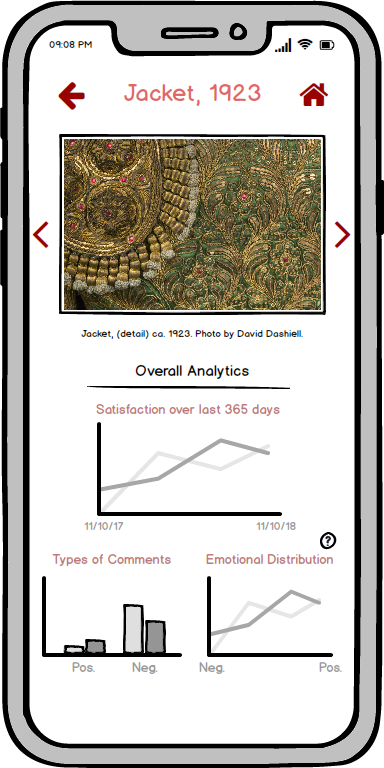
The user starts at the home screen. They then have a couple options from here: click the all feedback button, or click one of the exhibits listed on the bottom half of the screen. Let’s first assume they click one of the exhibits. They will then be taken to the analytics for the exhibit they clicked, showing both the overall analytics for the exhibit and an alphabetically organized set of the artwork in that exhibit.
The graphs from the overall analytics are based on what we found are the most important and feasible pieces of information (feasible based on assuming we have visitor feedback data available, and important based on discussion with a curator).
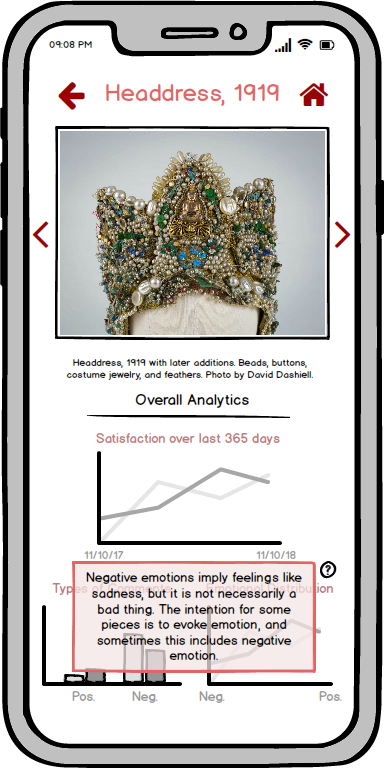
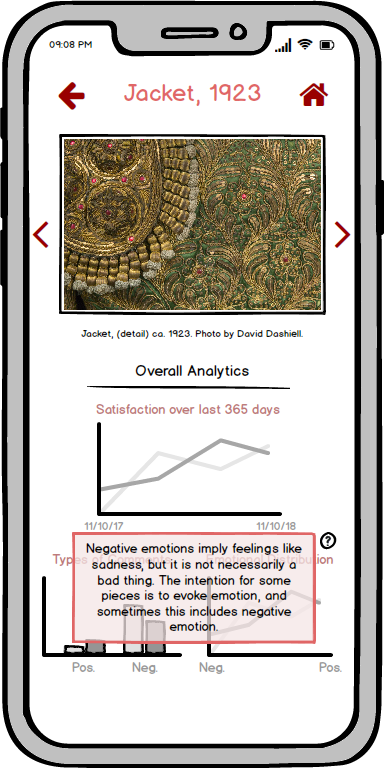
Now, let’s say the user clicks on a specfic peice of artwork. They will then be taken to the artwork analytics page which shows the piece of art, and the same graphs, except using data for that specific piece work. Additionally, the emotional distribution graph might be confusing since negative emotion may seem like a bad thing, so there is a help button to explain that this might not be the case.
Task 2 Connecting Curators with Museum Visitors
Now let’s assume users click the home button to get back to the home page.
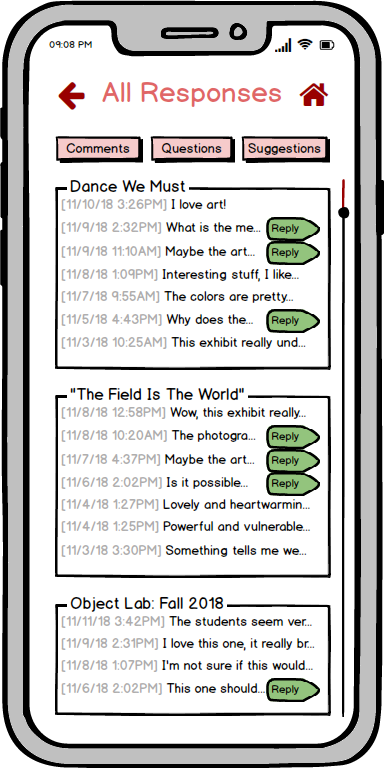
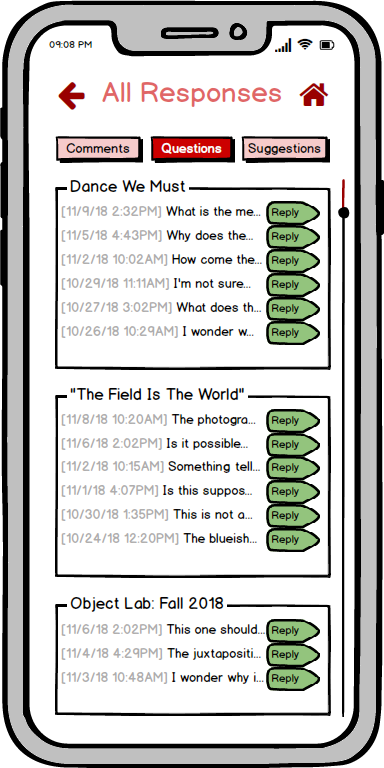
If they click the all feedback button, the user will then be taken to the “all feedback” screen, which will show them all visitor feedback from most recent to least recent, categorized by exhibit.
We have also determined that there are 3 types of comments: questions, suggestions (not a question, but comment implies that action should be taken), and general comments (comments that don’t imply action should be taken). The user can then click one of the checkboxes in order to make certain types of questions appear or disappear based on what they want to see.
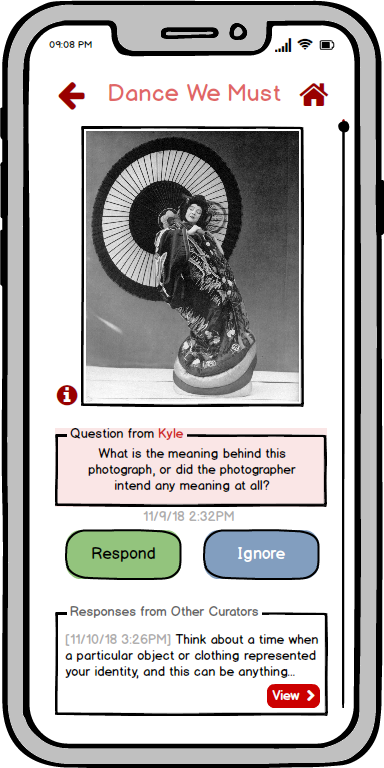
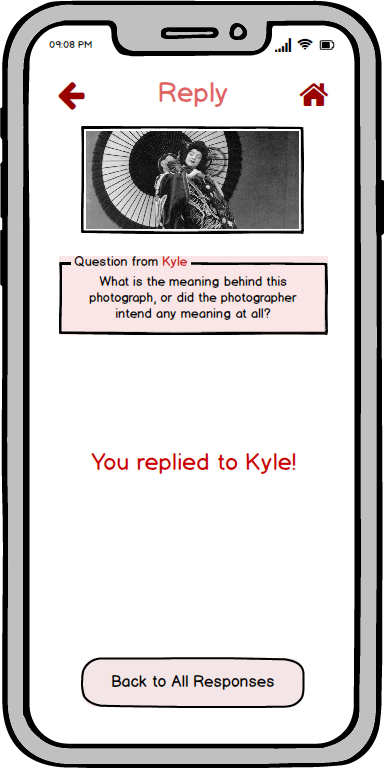
If a user wants to reply to a question, they can click “reply” (“ignored” and “replied” are also still clickable, and take you to the same screen). They will then be taken to a response preview screen where they can see the exhibit/artwork and the full question. The curator can see responses from previous curators, edit those responses, ignore the question (which will mark the question as ignored), or respond to the question.
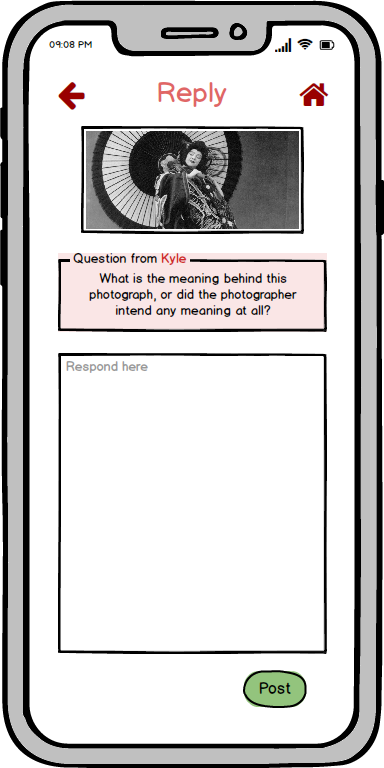
The user can then click respond to open the response screen, allowing them to type and submit their response.